Dual EMA Crossover Trading Strategy

Overview
This strategy uses the golden cross and death cross of dual EMA lines to determine entry and exit timing. Specifically, when the fast EMA line crosses above the slow EMA line from the bottom, a golden cross signal is generated for long entry. When the fast EMA line crosses below the slow EMA line from the top, a death cross signal is generated for short entry. This strategy is simple and easy to implement, and is a very common trading strategy.
Strategy Logic
The core code of this strategy is as follows:
pine
fast = input(25, title="Fast")
slow = input(75, title="Slow")
matype1=ema(source, fast)
matype2=ema(source, slow)
longCondition = crossover(matype1, matype2)
shortCondition = crossunder(matype1, matype2)
if (longCondition)
strategy.entry("Long", strategy.long)
if (shortCondition)
strategy.entry("Short", strategy.short)
This strategy first sets two EMA lines, with the fast EMA period as 25 and slow EMA period as 75. It then calculates the values of the two EMA lines. When the fast EMA crosses above the slow EMA, the longCondition becomes true. When the fast EMA crosses below the slow EMA, the shortCondition becomes true. Upon the corresponding conditions being true, it goes long or short.
This strategy utilizes the smoothing feature of EMA to filter market noise, while being able to quickly capture trend changes. The golden and death crosses between the two EMA lines form relatively strong trading signals, which can effectively control trading risk.
Advantage Analysis
The advantages of this strategy include:
-
The logic is simple and intuitive, easy to understand and implement.
-
EMA smoothes market fluctuation and filters false signals effectively.
-
Golden cross and death cross are strong trading signals to control risk.
-
Flexible EMA periods suit different market environments.
-
Easy to combine with other technical indicators.
-
EMA parameters can be optimized for better results.
Risk Analysis
The risks of this strategy include:
-
Frequent ineffective signals in range-bound markets as EMA crosses frequently.
-
Lagging of EMA may miss short-term opportunities.
-
EMA crossover alone cannot identify trend reversal, limiting profit potential.
-
Fixed EMA periods cannot adapt to market changes.
-
Requires significant capital, otherwise magnifies risk.
-
Needs strict stop loss, otherwise single loss can be huge.
Optimization Directions
The strategy can be optimized in the following aspects:
-
Optimize EMA periods for different market conditions.
-
Add other filters like MACD, Bollinger Bands to improve signal quality.
-
Add trend judging indicators like ATR, ADX to reduce ineffective trades.
-
Incorporate multi-timeframe analysis to determine trend direction.
-
Use machine learning to dynamically optimize EMA periods.
-
Optimize position sizing to control risk.
-
Optimize stop loss strategies to limit single loss.
Summary
This strategy uses dual EMA golden cross and death cross as trading signals, forming a classical trend following strategy. It is simple and easy to implement, and can be combined with other indicators, suiting investors with relatively low requirements on trend judgment. But it also has profit limits and risks, requiring proper optimizations for different market environments. Overall, it provides an excellent basis for strategy development and in-depth research.
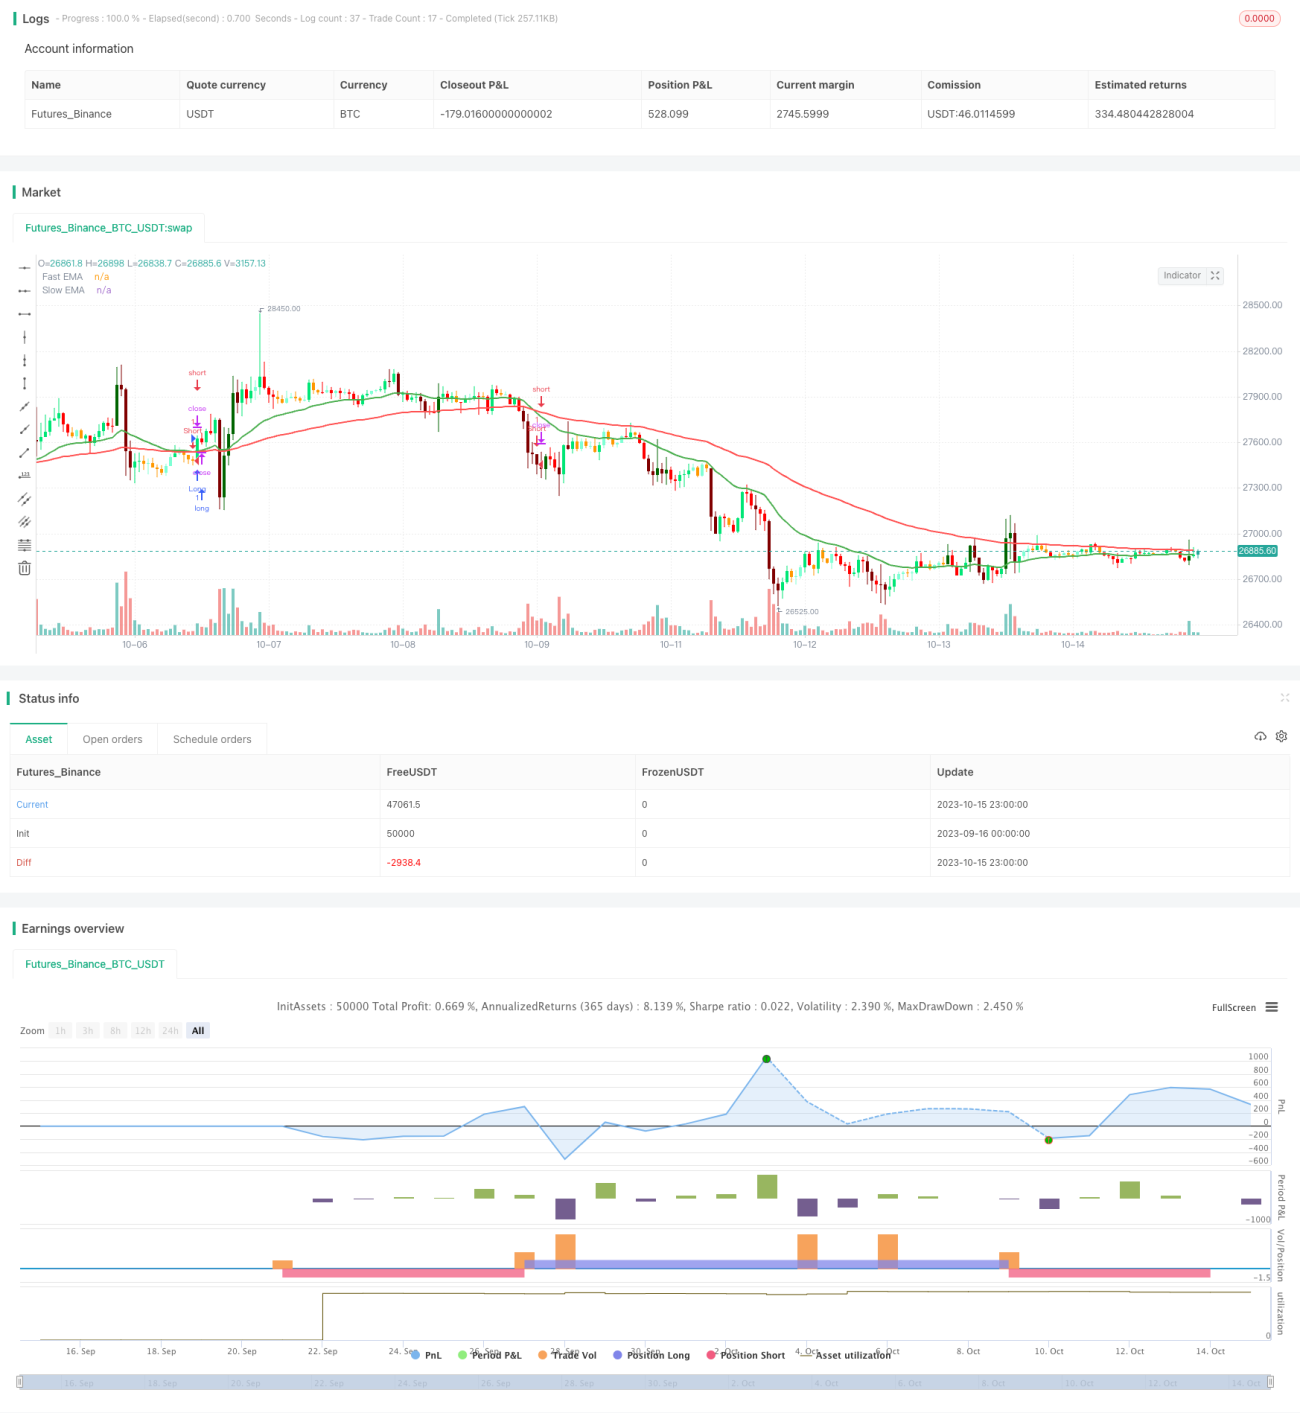
/*backtest
start: 2023-09-16 00:00:00
end: 2023-10-16 00:00:00
period: 1h
basePeriod: 15m
exchanges: [{"eid":"Futures_Binance","currency":"BTC_USDT"}]
*/

// This source code is subject to the terms of the Mozilla Public License 2.0 at https://mozilla.org/MPL/2.0/
// Double EMA CROSS By © EmreE (Emre Ertürk) Also thx for KivancOzbilgic color based bars

//@version=4- 1