Bull Trend Riding Strategy Based on Stochastic RSI with Special Rules for Heavy Bullish Bias

Overview
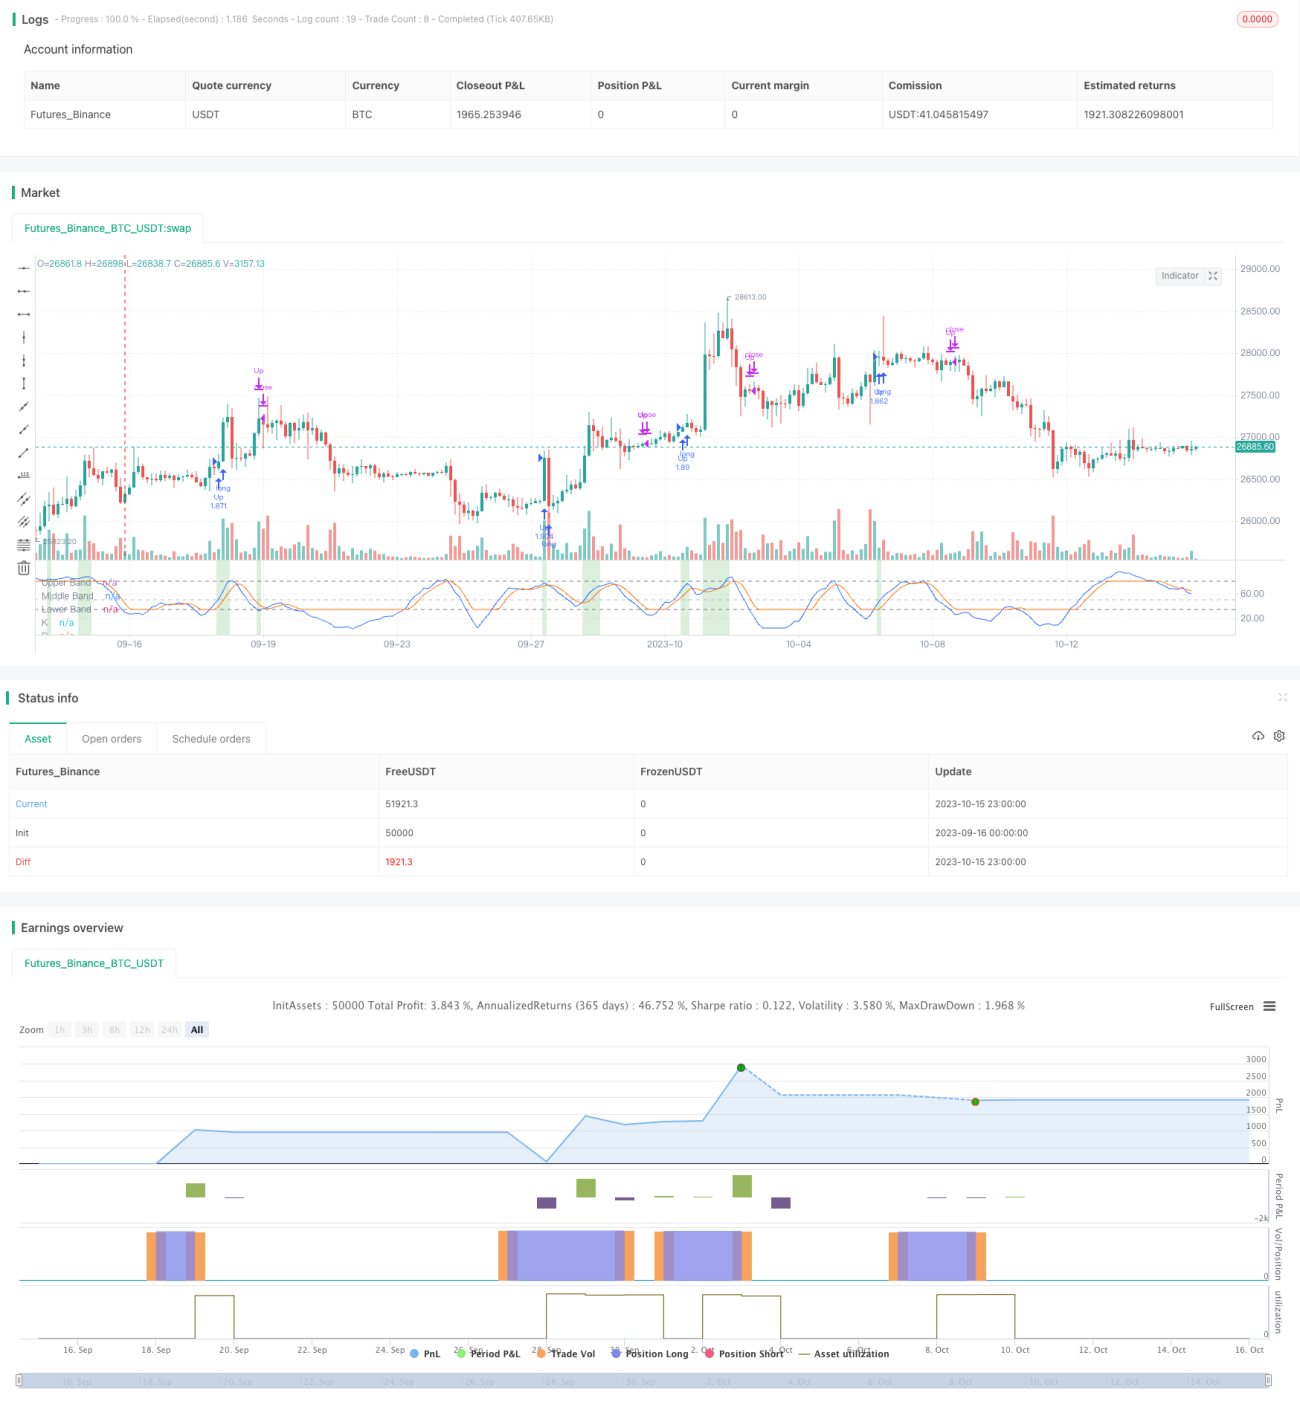
This is a long-only trend following strategy. It utilizes Donchian Channel and StochRSI indicator to identify strong bull trends and participate with low risk.
Strategy Logic
This strategy uses the following two indicators for trend identification:
-
Donchian Channel: Calculates 6-day EMA of recent 30 bar's highest high, as the channel's upper band. If close is above upper band, it indicates a bull trend currently.
-
StochRSI indicator: Including %K line and %D line. This strategy adds a lower band on %K line, default is 35. When %K line crosses below lower band, it signals an end of the bull trend.
Specifically, the trading logic is:
-
When close is above Donchian upper band, it shows a green background, indicating a bull trend.
-
When StochRSI %K is above the default lower band 35, go long.
-
When %K crosses below lower band, close long position.
As we can see, this strategy utilizes both trend filter and oscillator indicator, to participate in bull trends with low risk. Donchian Channel filters non-trending markets, ensuring only taking long in a bull trend. StochRSI identifies overbought/oversold status, to close position in a timely manner.
Advantages
The advantages of this strategy include:
-
Only long, avoiding losses in bear markets.
-
Using Donchian Channel to identify trends, filtering non-trending markets.
-
Adjustable parameters of StochRSI, can set entry and exit levels based on risk appetite.
-
Suitable for stocks with sustained uptrend. Can generate continuing profits.
-
Simple and clear logic, easy to understand and implement.
Risks
There are also some risks:
-
Missing the entry point, unable to capture full profits in trend.
-
Sudden trend reversal, indicator fails to exit in time, leading to large losses.
-
Inappropriate parameters setting increases trading frequency and false signals.
-
Only suitable for long-term bull markets, not for ranging or bearish markets.
-
Need to watch the fundamentals to avoid picking stocks with weakening fundamentals.
Improvements
Some ways to improve the strategy:
-
Optimize parameters for markets with different volatility.
-
Add stop loss to limit losses in single trade.
-
Combine fundamentals and news, avoid stocks with weakening fundamentals.
-
Optimize entry timing, ensure timely entry through repeated testing.
-
Optimize exit timing, avoid premature exit in bull trend.
-
Test on different stock samples to evaluate performance. Find the optimal stock types.
Conclusion
This strategy identifies trend with Donchian Channel, and trades with StochRSI signals. It can effectively follow bull trends with low risk. The pros are simple logic and continuously capturing upside momentum. Need to pay attention to parameter tuning, stock selection, and further enhancements. If executed properly, this strategy can be an effective tool to participate in long-term bull markets.
- 1