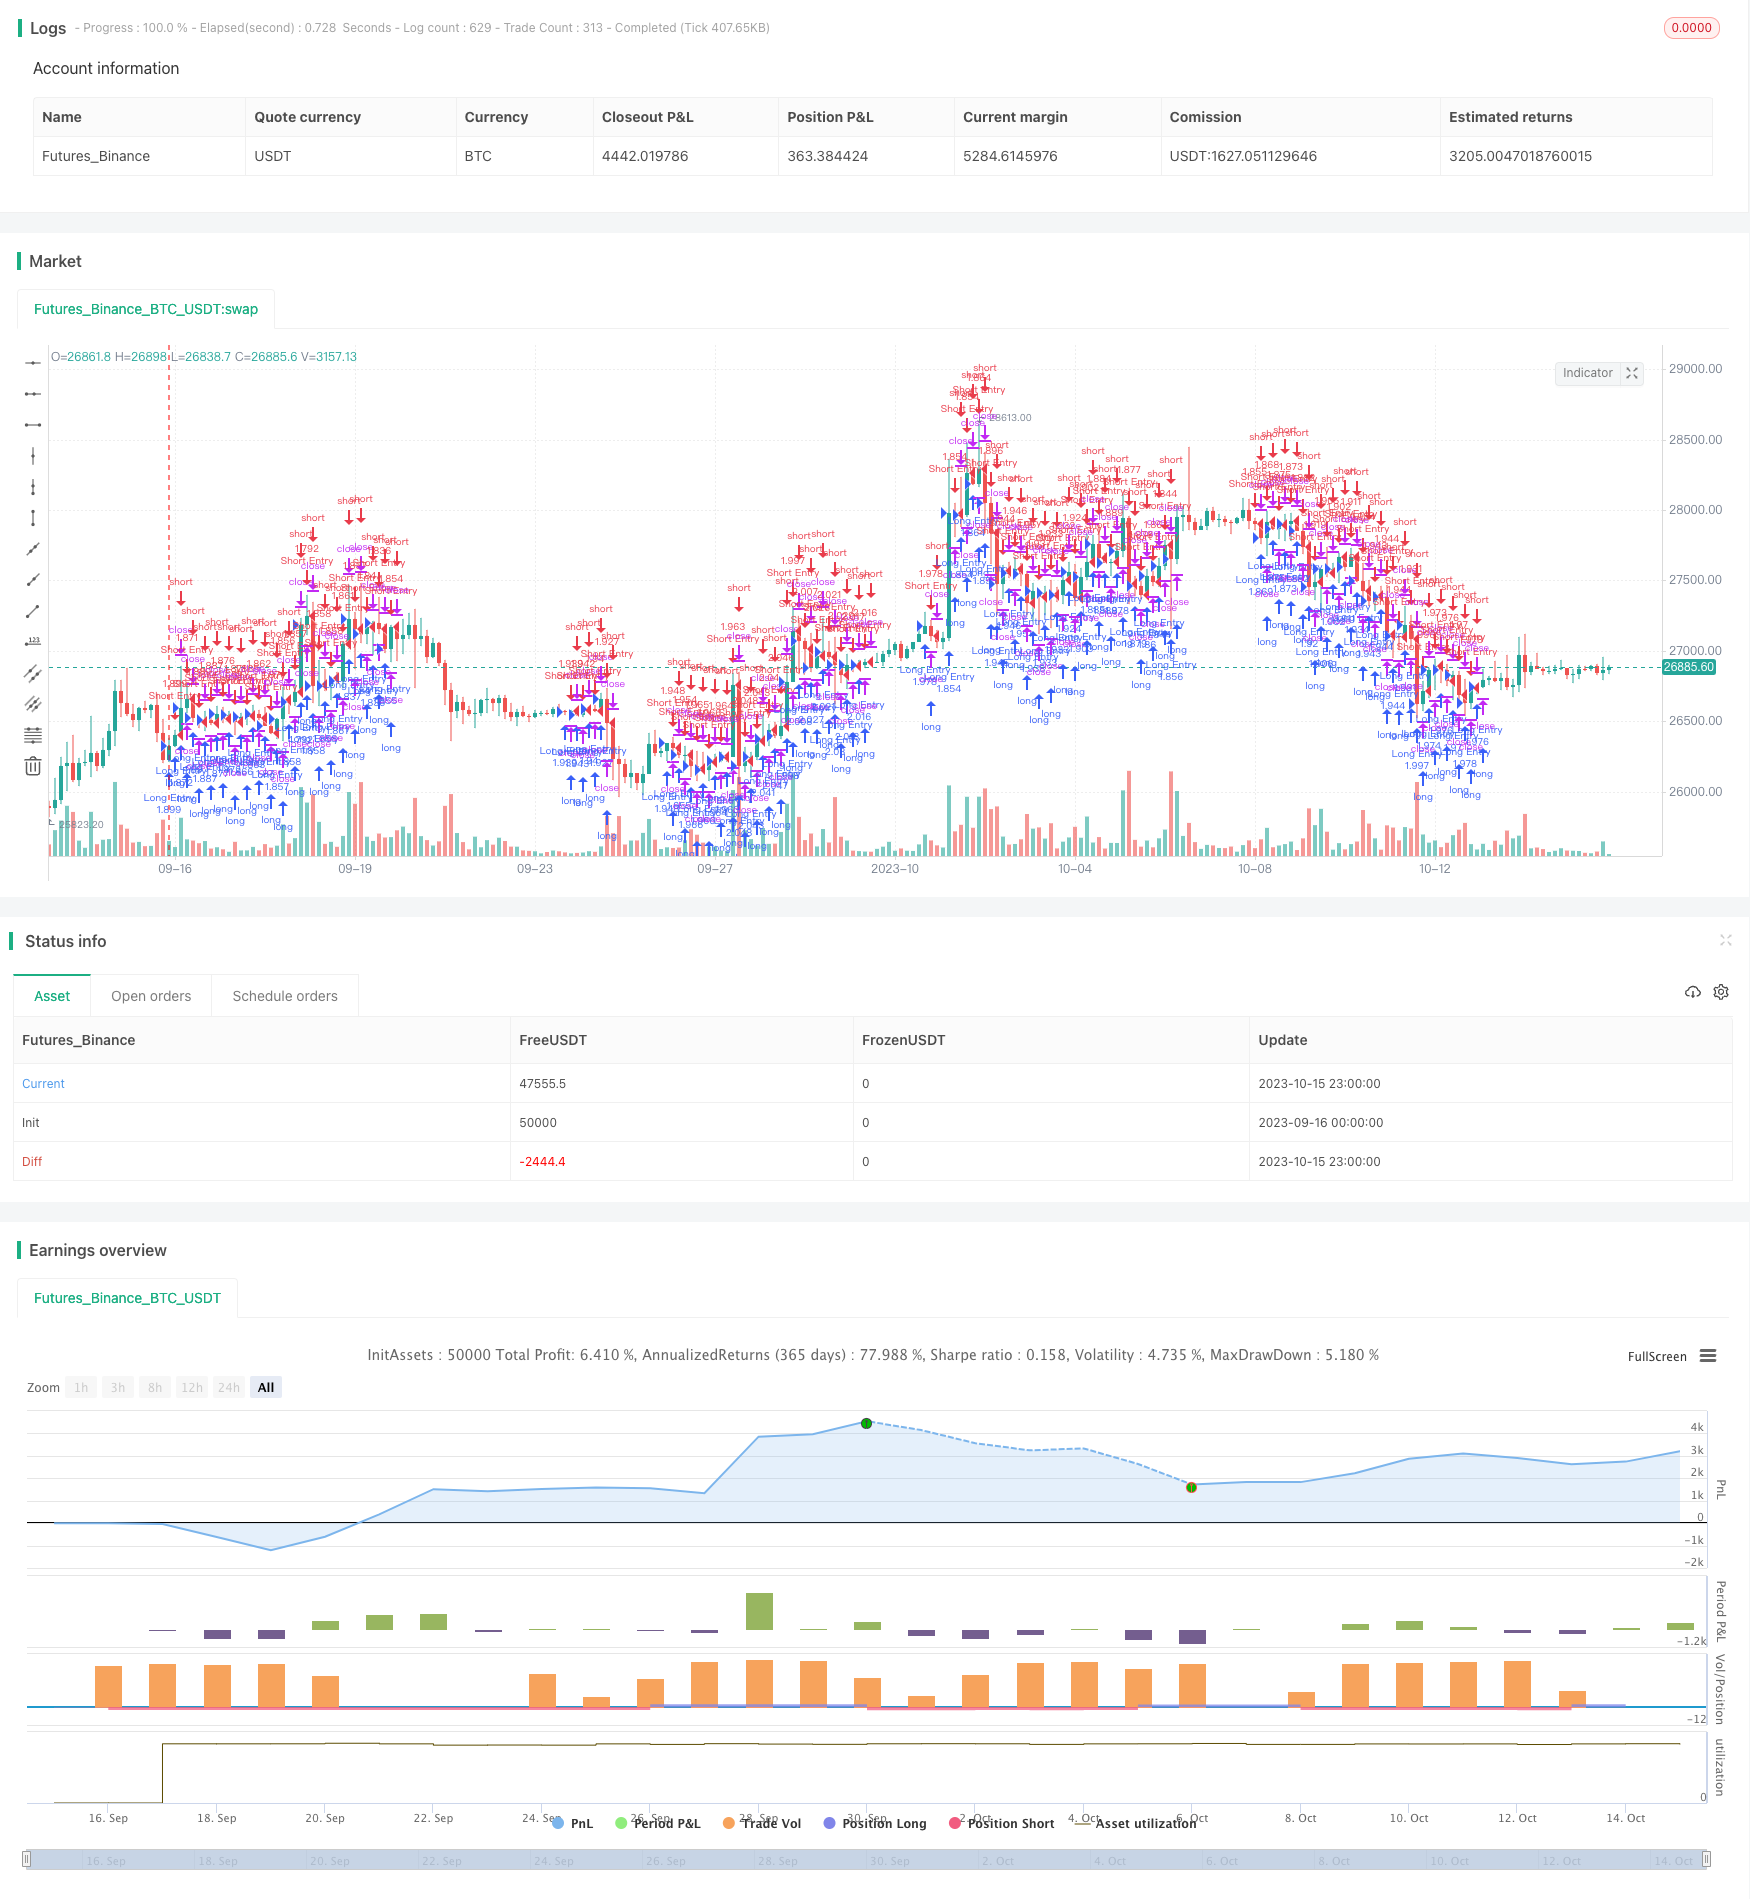
概述
该策略是一个利用MACD指标识别多空方向的趋势跟踪策略。它通过计算快速移动平均线和慢速移动平均线的差值,生成MACD主线。策略使用MACD主线和信号线的黄金交叉来产生买入信号,死叉来产生卖出信号,实现多空平衡跟踪。
策略原理
代码首先设置了回测的起止时间,用于测试策略的历史表现。
然后是MACD指标的计算,包括快速移动平均线、慢速移动平均线和MACD均线的长度设置。快速线反应更敏感,慢速线反应更稳定。它们的差值形成MACD主线,再通过均线形成MACD信号线。当差值上穿零轴时产生多头信号,下穿零轴时产生空头信号。
根据多头和空头信号,记录最后一次产生信号的时间。当快线和慢线发生正交时就确认并记录买入/卖出信号,这时就可以开仓了。
进场后,持续跟踪持仓的最高价和最低价。设定一个止损百分比,当亏损达到该百分比时止损退出。
策略优势
MACD指标能有效识别趋势,属于技术分析的经典指标之一。
快慢平均线的差值设计,可以提早捕捉到价格变化的动量和方向。
利用均线的滤波作用,可以过滤掉部分假信号。
策略加入了止损机制来控制风险。
策略风险
MACD指标容易产生假信号,指标本身可优化空间有限。
止损点设置不当可能过于活跃或保守,需要针对不同品种单独优化。
固定数量头寸容易使杠杆过高,可以考虑根据资金规模设定风险敞口。
回测时间窗口选择合理性需要验证,避免过拟合。
策略优化
优化快慢均线参数组合,找到最佳参数对不同品种进行拟合。
增加其他指标过滤,如K线形态、布林带、RSI等来验证信号。
可以根据回撤、夏普比率等指标评估不同止损点的效果。
优化止损策略,如移动止损、挂单止损等方式。
尝试根据资金变化、波动率等设定动态仓位。
总结
MACD多空平衡策略是一个基于经典技术指标的趋势跟踪策略。它具有对价格变化动量的敏感捕捉能力,可以通过参数优化很好地适应不同品种。结合更多滤波指标、止损方式以及动态仓位管理,可以继续提升策略的稳定性和盈利能力。
/*backtest
start: 2023-09-16 00:00:00
end: 2023-10-16 00:00:00
period: 3h
basePeriod: 15m
exchanges: [{"eid":"Futures_Binance","currency":"BTC_USDT"}]
*/

//@version=2
strategy("MACD BF", overlay=true, initial_capital=10000, default_qty_type=strategy.percent_of_equity, default_qty_value=100, commission_type=strategy.commission.percent, commission_value=0.0)

/////////////// Component Code Start ///////////////
testStartYear = input(2017, "Backtest Start Year")
testStartMonth = input(1, "Backtest Start Month")
testStartDay = input(1, "Backtest Start Day")
testPeriodStart = timestamp(testStartYear,testStartMonth,testStartDay, 0, 0)

testStopYear = input(2019, "Backtest Stop Year")
testStopMonth = input(12, "Backtest Stop Month")
testStopDay = input(31, "Backtest Stop Day")
testPeriodStop = timestamp(testStopYear,testStopMonth,testStopDay, 0, 0)

// A switch to control background coloring of the test period
testPeriodBackground = input(title="Color Background?", type=bool, defval=true)
testPeriodBackgroundColor = testPeriodBackground and (time >= testPeriodStart) and (time <= testPeriodStop) ? #00FF00 : na
bgcolor(testPeriodBackgroundColor, transp=97)

testPeriod() => true

///////////////  MACD Component - Default settings for one day. ///////////////
fastLength = input(12) // 72 for 4hr
slowlength = input(26) // 156 for 4 hr
MACDLength = input(12)  // 12 for 4hr

MACD = ema(close, fastLength) - ema(close, slowlength)
aMACD = ema(MACD, MACDLength)
delta = MACD - aMACD

long = crossover(delta, 0)
short = crossunder(delta, 0)

last_long = long ? time : nz(last_long[1])
last_short = short ? time : nz(last_short[1])

long_signal = crossover(last_long, last_short)
short_signal = crossover(last_short, last_long)

last_open_long_signal = long_signal ? open : nz(last_open_long_signal[1])
last_open_short_signal = short_signal ? open : nz(last_open_short_signal[1])

last_long_signal = long_signal ? time : nz(last_long_signal[1])
last_short_signal = short_signal ? time : nz(last_short_signal[1])

in_long_signal = last_long_signal > last_short_signal
in_short_signal = last_short_signal > last_long_signal

last_high = not in_long_signal ? na : in_long_signal and (na(last_high[1]) or high > nz(last_high[1])) ? high : nz(last_high[1])
last_low = not in_short_signal ? na : in_short_signal and (na(last_low[1]) or low < nz(last_low[1])) ? low : nz(last_low[1])

sl_inp = input(5.0, title='Stop Loss %', type=float)/100

/////////////// Strategy Component ///////////////
// Strategy Entry
if testPeriod()
    strategy.entry("Long Entry",  strategy.long, when=long_signal)
    strategy.entry("Short Entry", strategy.short, when=short_signal)

since_longEntry = barssince(last_open_long_signal != last_open_long_signal[1]) // LONG SL
since_shortEntry = barssince(last_open_short_signal != last_open_short_signal[1]) // SHORT SL

slLong = in_long_signal ? strategy.position_avg_price * (1 - sl_inp) : na
slShort = strategy.position_avg_price * (1 + sl_inp)
long_sl = in_long_signal ? slLong : na
short_sl = in_short_signal ? slShort : na

// Strategy SL Exit
if testPeriod()
    strategy.exit("Long SL", "Long Entry", stop=long_sl, when=since_longEntry > 1)
    strategy.exit("Short SL", "Short Entry", stop=short_sl, when=since_shortEntry > 1)

//plot(strategy.equity, title="equity", color=blue, linewidth=2, style=areabr)