Dual Moving Average Monitoring Model

Overview
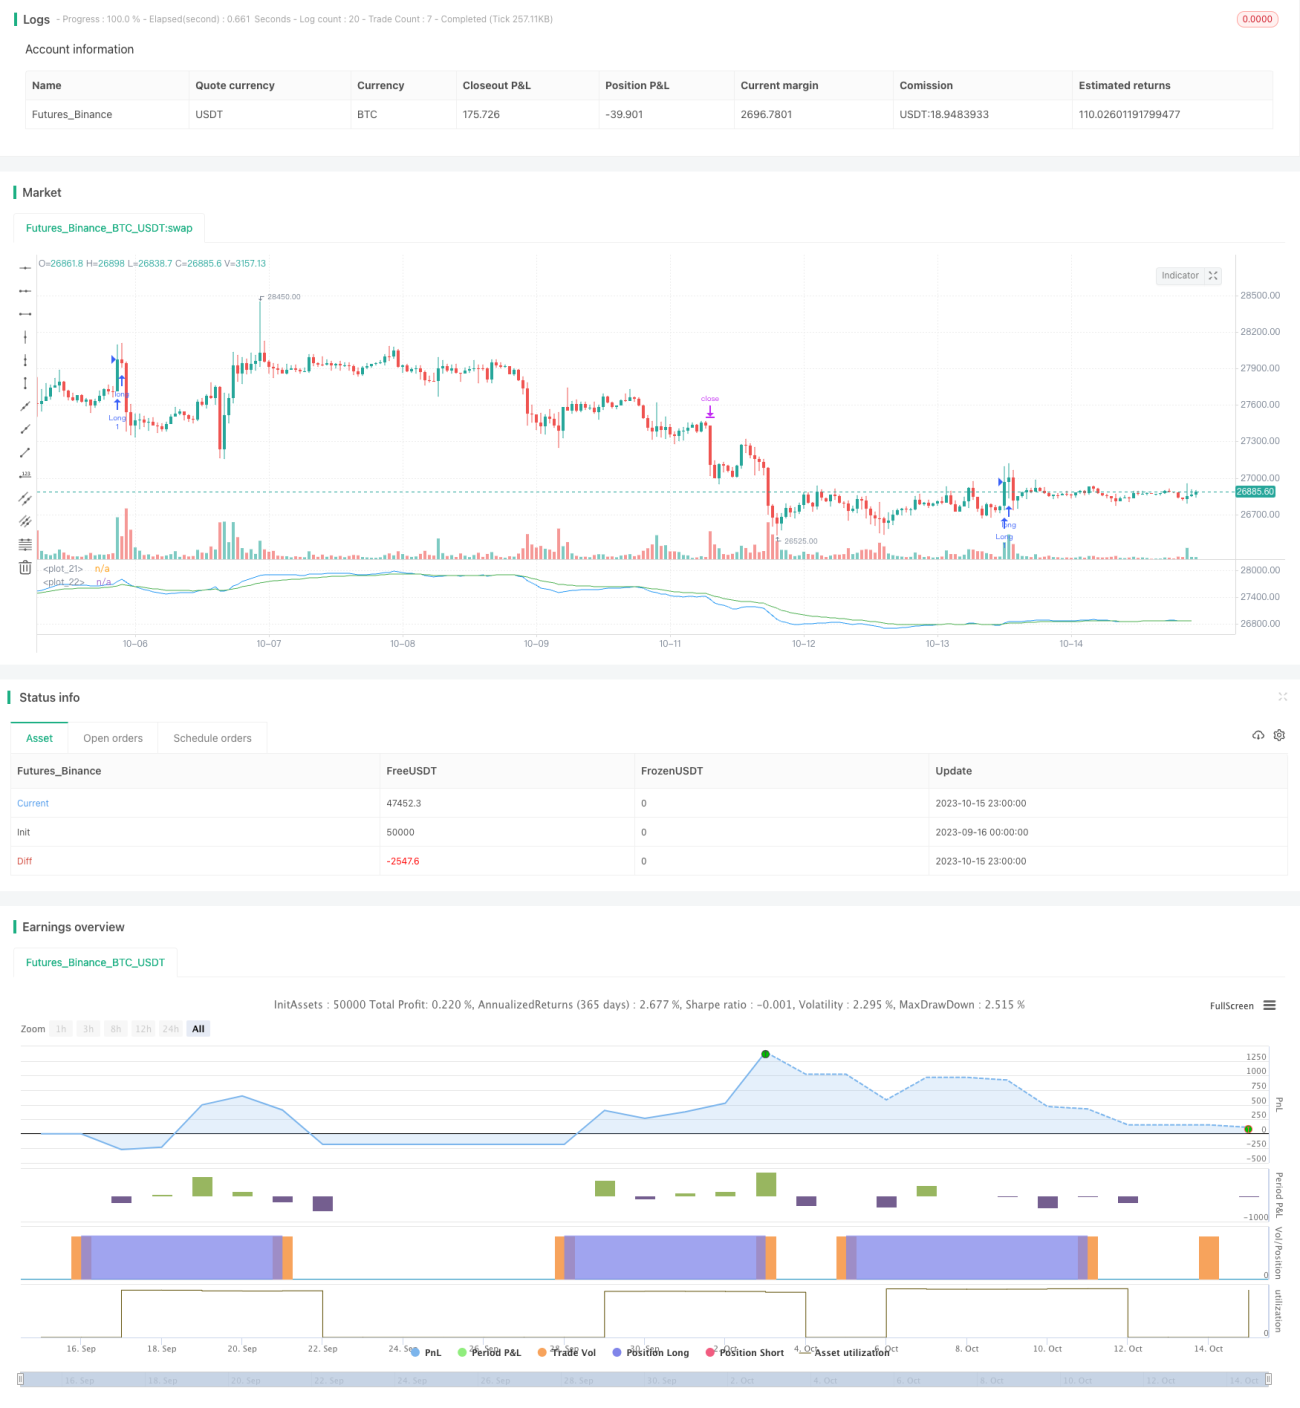
This strategy uses a combination of dual exponential moving averages (EMA) and moving average crossover (MACD) indicators to identify overvalued stocks in the short term and take short positions to profit from price declines. The strategy takes full advantage of the EMA's ability to react quickly to price changes and MACD's strength in monitoring momentum direction, capturing short-term profit opportunities at turning points between bulls and bears.
Strategy Logic
-
Calculate 8-day EMA and 26-day EMA. When 8-day EMA crosses above 26-day EMA, it is considered a buy signal.
-
Calculate MACD with 12-day EMA, 26-day EMA and 9-day EMA of the difference called DEA. When MACD crosses above DEA, it is considered a buy signal.
-
Entry rule: 8-day EMA > 26-day EMA and MACD crosses above DEA, long when both conditions are met.
-
Exit rule: Set trailing stop loss at 3% of entry price, trailing stop loss at 1% of entry price, exit when either is touched.
The strategy utilizes both the fast reaction of EMA to price and MACD's judgment on momentum direction, identifying the key turning points from bull to bear. The fast EMA reflects the correction of short-term intrinsic value against the slower EMA, while MACD reflects changes in trading power anticipating the direction of the moving averages, improving accuracy of capturing trading opportunities using dual indicators.
Advantage Analysis
-
EMA and MACD combination improves accuracy of capturing trading signals. EMA catches price trends while MACD judges momentum direction changes, combined they identify short-term extremums and avoid losses from false breakouts.
-
Trailing stop loss controls risks and exits timely. The 1% trailing stop set after entry avoids loss enlargement.
-
Solid backtest data. Strategy is backtested through the entire bear market in 2022, simulating real trading environments.
-
Flexible parameter tuning. Stop loss ratio, position sizing ratio are customizable to match personal risk preference.
Risk Analysis
-
Frequent trading requires close tracking. The 5-min timeframe means high frequency of entries and exits, requiring sufficient time to follow up the trades.
-
Trailing stop loss may exit prematurely. Overly tight trailing stop loss could lead to premature exits.
-
Poor performance in ranging markets. EMA and MACD work better for trending markets.
-
Trading costs need consideration. Each trade corresponds to commissions, frequent trading increases costs.
Optimization Directions
-
Adjust EMA period parameters to optimize entries and exits. Can test shortening fast EMA period, enlarging spread between EMAs to find optimal combinations.
-
Optimize stop loss ratio to lower premature stop risk. Appropriately widening the trailing stop loss avoids overly aggressive stops.
-
Test different holding periods to find optimum. Evaluate returns for different holding periods to identify best holding duration.
-
Evaluate adding other technical filters. Test adding volatility index etc to improve effectiveness of trading decisions.
Conclusion
This dual EMA and MACD trading strategy aims to capture short-term pullback opportunities for shorting and profiting. It fully utilizes the fast reaction of EMA and momentum change judgment strength of MACD to improve accuracy in trade timing with dual confirmation. Optimization spaces lie in parameter tuning, slippage control, holding period etc. Careful parameter optimization can lead to good returns.
- 1