Relative Body Index Crossover Strategy

Overview
This strategy mainly uses the moving average crossover signals of the relative body ratio (RB) of daily candlesticks to determine the trend, together with stop loss and take profit for automated trading. The "Relative Body Strength" in the strategy name refers to the moving average of the relative body strength of daily candlesticks.
Strategy Logic
The strategy is based on Vitelot's RBI indicator, which calculates the moving average of the relative body ratio (RB) of daily candlesticks. The RB is calculated as:
The formula calculates the ratio of the real body to the full length of the candlestick for bullish candles, taking positive values; and negative values for bearish candles. RB ranges from -1 to 1.
The RBI indicator uses the moving average of RB to filter out noise and capture the essence of market trends. A buy signal is generated when RBI crosses above its signal line, and a sell signal when crossing below.
To avoid false signals during uncertain bullish phases, the strategy also checks if the closing price is above the 13-period EMA before generating a true buy signal for long position. Similarly, only when the close is below the 13 EMA will the short position be executed.
The strategy also implements stop loss and take profit to control risks and lock in profits. After opening position, profit will be trailed based on the set points, with a fixed stop loss in points.
Advantage Analysis
-
RBI filters out significant noise and captures market trend characteristics, avoiding false signals from ranging markets.
-
Using moving average filter avoids false signals effectively during uncertain bullish phases, reducing losses from shorts.
-
Stop loss and take profit helps reduce loss risk on individual positions and lock in profits, improving overall profitability.
-
The strategy has few parameters and is easy to understand, suitable for automated trading.
Risk Analysis
-
The strategy relies solely on RBI, any wrong signals from the indicator could lead to failure.
-
Poor parameter tuning of the indicator could also worsen the quality of trading signals.
-
No technical indicators can completely avoid losses in certain market conditions.
-
Stop loss set too tight may result in too frequent stop outs; too wide may lead to large losses on single positions.
-
Insufficient drawdown control could lead to account wipeout risks.
Optimization Directions
-
Different parameter combinations can be tested to optimize the RBI parameters.
-
Additional indicators could be added for signal filtering and quality improvements.
-
Machine learning can be used to train and optimize the stop loss and take profit parameters.
-
Risk management strategies can be added to control overall position sizing and risk exposure.
-
Different holding periods like overnight holdings or short term scalping could be explored.
Conclusion
Overall this is a relatively simple and straightforward trend following strategy. It uses RBI crossover to determine trend direction, with additional filters and stop loss/take profit to control risks, effectively avoiding false signals from ranging markets. But no technical indicators can completely avoid risks. Continuous improvements such as parameter optimization, risk management are still needed for long term stable excess returns. The logic is clear and easy to understand, suitable for automated trading. It is a very practical trend following strategy.
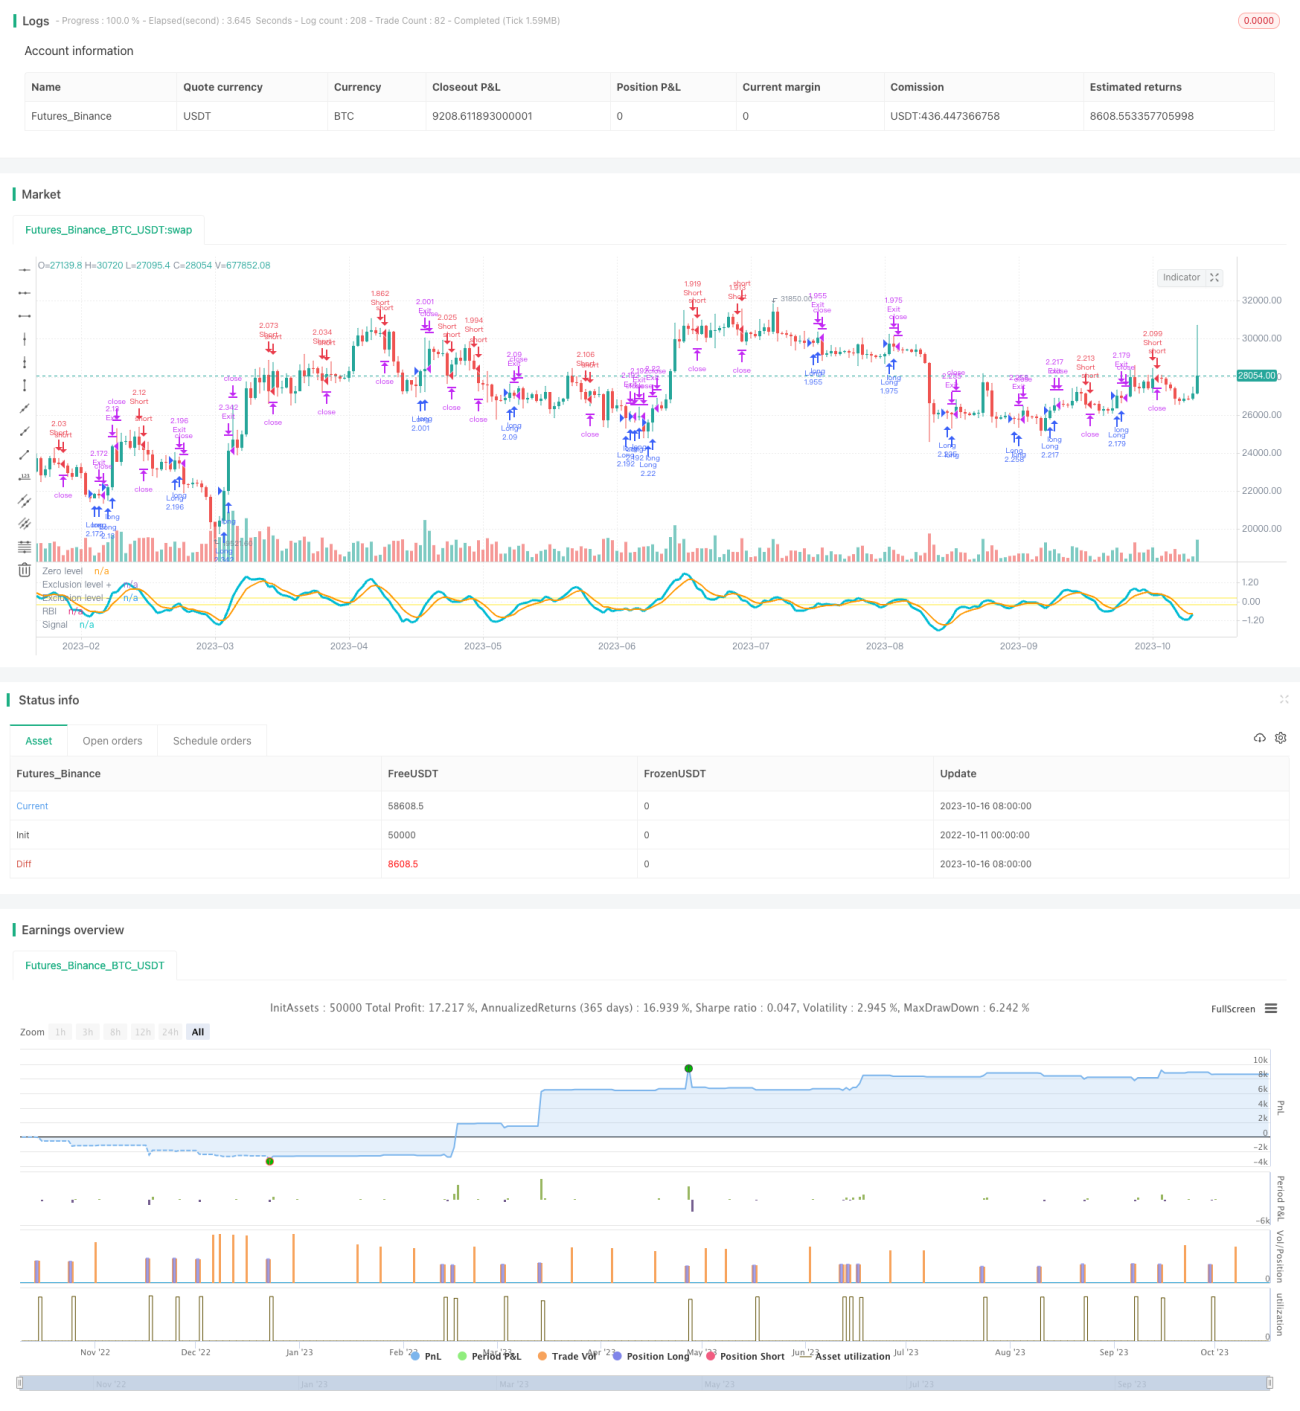
/*backtest
start: 2022-10-11 00:00:00
end: 2023-10-17 00:00:00
period: 1d
basePeriod: 1h
exchanges: [{"eid":"Futures_Binance","currency":"BTC_USDT"}]
*/

//@version=3
strategy("RBI Backtest /w TSSL", shorttitle="RBI Strategy", overlay=false, default_qty_type = strategy.percent_of_equity, default_qty_value = 100, initial_capital = 10000, slippage = 5)
// RBI:
// The EMA of the relative body (RB) of Japanese candles is evaluated.- 1