Multi-Indicator Buy and Sell Strategy

Overview
This strategy combines moving average, overbought-oversold and volatility rate indicators to buy on dips when oversold and sell on rallies when overbought, in order to track trends.
Strategy Logic
Take positions when RSI and Stoch are both in oversold/overbought zones and AO oscillator shows reversal signal. Specifically, go long when RSI and Stoch are low (below 30 and 20) and AO turns from negative to positive; go short when RSI and Stoch are high (above 70 and 80) and AO turns from positive to negative. Set stop loss and take profit based on ATR value to adjust loss/profit levels according to market volatility.
The strategy mainly uses four indicators:
- AO oscillator: reflects price momentum, can be used to identify trend reversal.
- RSI: reflects overbought/oversold levels. Below 30 is oversold zone.
- Stoch: reflects overbought/oversold zones. Below 20 is oversold zone.
- ATR: reflects recent price volatility.
When AO shows reversal signal and RSI & Stoch are both in oversold/overbought zones, price may reverse. Take positions at this time. Use ATR to set stop loss and take profit prices to avoid being trapped by adjusting loss/profit range based on volatility.
Advantages
- Use multiple indicators to confirm signals, avoiding wrong trades from single indicator.
- Set stop loss/profit based on volatility to control single loss.
- Simple and clear logic, easy to understand and implement.
- Take advantage of overbought/oversold situations to capture reversals.
Risks and Solutions
- AO may generate false signals. Needs to combine with RSI and Stoch to avoid wrong trades.
- Fixed parameters may fail to adapt to market changes. Parameters need to be optimized.
- Stop loss too close may trigger frequent stops. Can loosen stop range or use exit strategies.
- Fixed take profit may exit too early or late. Can use adaptive take profit or partial exits.
To reduce risks, optimize in below aspects:
- Optimize parameters to adapt to different periods and instruments.
- Improve stop loss methods like trailing stop, partial exits.
- Optimize entry rules to avoid false signals.
- Optimize take profit ways like adaptive take profit, segmented by trends.
Optimization Directions
Below aspects can be optimized for the strategy:
-
Optimize parameter settings by traversing different values.
-
Add filter conditions on entry to avoid false signals.
-
Optimize stop loss methods like trailing stop loss.
-
Optimize take profit ways like adaptive take profit.
-
Add automatic take profit near key levels to avoid pullback.
-
Optimize money management adjusting position size by risk.
-
Test and optimize parameters and stop/profit levels based on different instruments and timeframes.
-
Handle extreme events like avoiding trades during news or fast cut loss.
Summary
This strategy combines moving average, overbought-oversold and volatility systems to buy low and sell high, with strong trend following ability. But some problems like fixed parameters and improper stop loss exist. We can optimize from various aspects like parameter tuning, improving stop loss, adding filters to make it more robust. In real trading, need to test and optimize based on specific instruments and periods to maximize its efficacy and profitability.
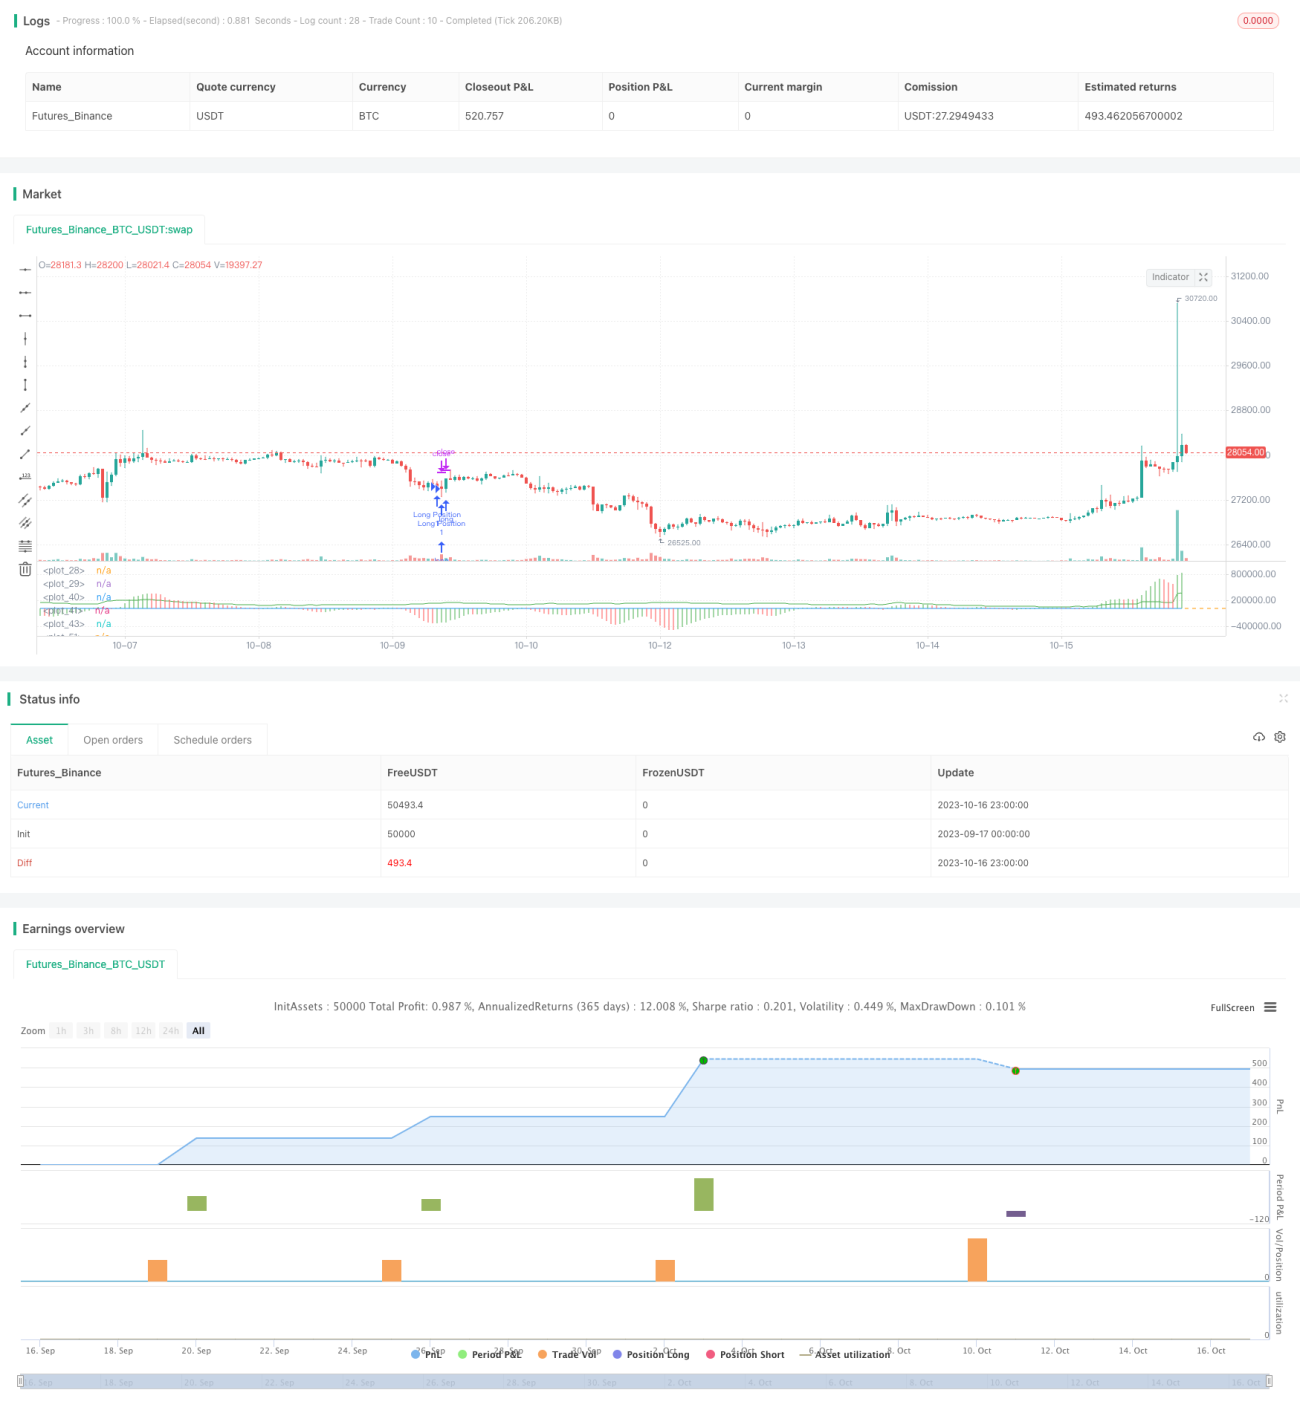
/*backtest
start: 2023-09-17 00:00:00
end: 2023-10-17 00:00:00
period: 1h
basePeriod: 15m
exchanges: [{"eid":"Futures_Binance","currency":"BTC_USDT"}]
*/

//@version=4

strategy("Buy&Sell Strategy depends on AO+Stoch+RSI+ATR by SerdarYILMAZ", shorttitle="Buy&Sell Strategy")
// Created by Serdar YILMAZ- 1