Hull Moving Average and Stochastic RSI Combination Trading Strategy

Author: ChaoZhang, Date: 2023-10-18 12:40:23
Tags:

img

Overview

This strategy uses the Hull Moving Average to determine the trend direction and combines it with the Stochastic RSI for entry signals. Long trades are taken when the HMA middle line crosses above the lower line, and short trades when it crosses below the upper line. In addition, long trades are entered when the Stochastic RSI K line crosses below the D line from the overbought zone, while short trades are entered on crosses above from the oversold zone.

Strategy Logic

The key components of this strategy are the Hull Moving Average for trend direction and the Stochastic RSI for timing entry signals.

Firstly, the Hull MA calculation includes formulas for the middle, upper and lower bands. The middle band uses a Weighted Moving Average, while the upper and lower bands are offset from the middle line.

The trend direction is determined by the relationship between the middle band and the upper/lower bands. An upward crossover of the middle line indicates buying pressure and an uptrend, while a downward crossover signals increased selling pressure and a downtrend.

The Stochastic RSI calculation is also defined, including the Smoothed K and D values. The K value uses an SMA smoothing on the RSI, while the D value is a second SMA smoothing on the K.

After the trend direction is determined, long trades are taken when the Stoch RSI K line crosses below the D line from the overbought zone during an uptrend. Short trades are taken when the K line crosses above the D line from the oversold area during a downtrend.

Combining the Hull trend filter and Stoch RSI overbought/oversold analysis provides a robust multi-factor approach to entering trades.

Advantages

The key benefits of this strategy are:

  1. The Hull MA effectively identifies the overall market trend direction.

  2. The Stoch RSI determines overbought/oversold levels to time entries.

  3. Using both together reduces false signals and combines strengths.

  4. Flexibility to optimize parameters for different symbols and timeframes.

  5. Hull bands identify potential dynamic support and resistance.

  6. Incorporates position sizing and risk management rules.

  7. Multi-asset capability through hull data dictionary.

  8. Optimizable components to improve profitability and reduce drawdowns.

Risks

Some risks to consider:

  1. Hull MA has lag and may miss trend changes.

  2. Stoch RSI may generate excessive signals if parameters not optimized.

  3. Mismatch between Hull and Stoch parameters can cause bad signals.

  4. Hull bands too wide or narrow will impact signal quality.

  5. Recent volatile markets challenge medium/long-term indicators.

  6. Data mismatches between Hull and Stoch causing false signals.

  7. Sharp trend changes not caught by Hull can cause losses.

  8. Need expanded testing on multiple timeframes and symbols.

Some ways to address these:

  1. Shorten Hull MA length for greater trend sensitivity.

  2. Optimize Stoch RSI to filter out false crosses.

  3. Find optimal Hull band channel width.

  4. Add additional confirming indicators like MACD.

  5. Incorporate stop loss strategies to control risk.

Optimization Opportunities

Some ways this strategy could be improved:

  1. Test on more symbols across various timeframes to verify robustness.

  2. Incorporate stop loss mechanics like trailing stops or moving averages.

  3. Optimize entry rules, set stricter filters to reduce false signals.

  4. Explore using Hull bands to better define support and resistance.

  5. Evaluate additional confirming indicators to improve signal reliability.

  6. Parameter optimization for lengths, overbought/oversold levels, etc.

  7. Introduce better position sizing and risk management.

  8. Added entry, stop loss and take profit rules essential for live trading.

  9. Optimize Hull length for better trend sensitivity.

  10. Add filters or confirming indicators to improve signal quality.

  11. Explore Hull bands for dynamic support/resistance levels.

  12. Optimize Stoch RSI parameters like length, overbought/oversold.

  13. Implement advanced position sizing and risk management.

Conclusion

Overall this is an effective approach combining trend and momentum. However, inherent indicator weaknesses mean signals should not be blindly trusted without further optimization and risk controls. With refined parameters, additional filters, and stop losses, this strategy offers potential. More extensive testing is needed for parameters, risk management, and position sizing to make it robust and profitable for live trading.
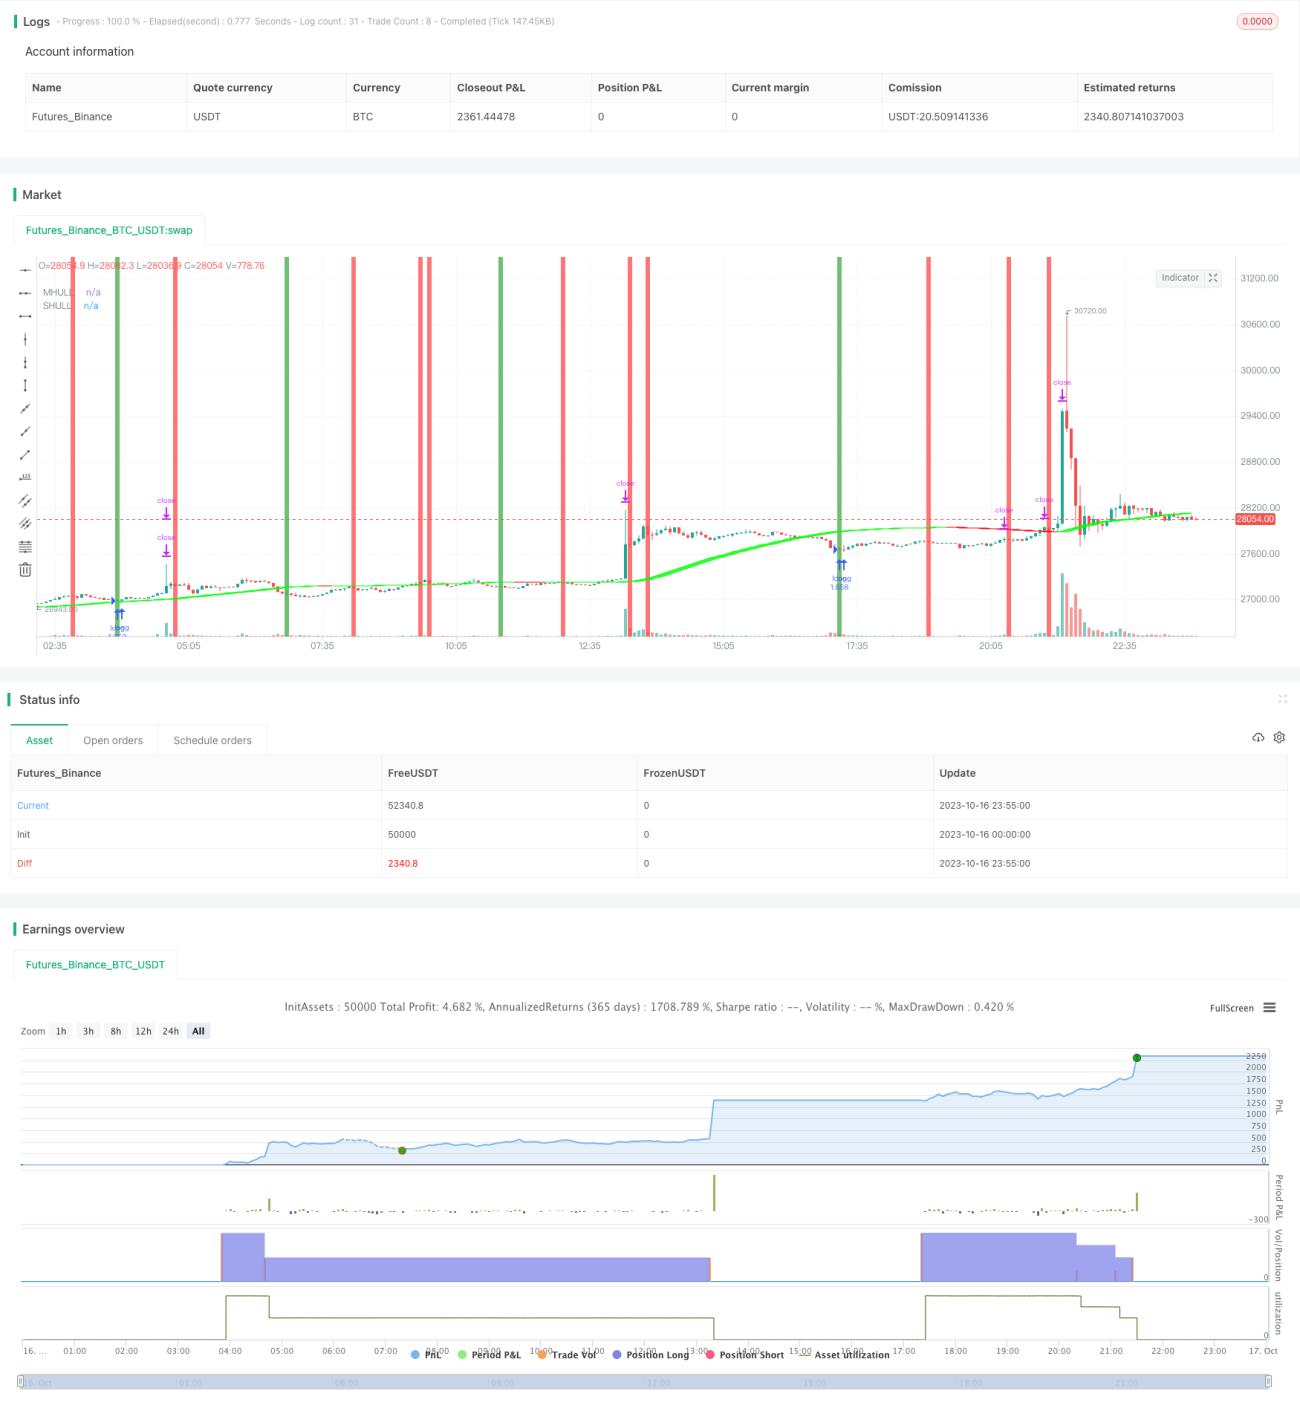

/*backtest
start: 2023-10-16 00:00:00
end: 2023-10-17 00:00:00
period: 5m
basePeriod: 1m
exchanges: [{"eid":"Futures_Binance","currency":"BTC_USDT"}]
*/

//@version=4
//Basic Hull Ma Pack tinkered by InSilico 
//Converted to Strategy by DashTrader
strategy("Hull Suite + Stoch RSI Strategy v1.1", overlay=true, pyramiding=1, initial_capital=100, default_qty_type= strategy.percent_of_equity, default_qty_value = 100, calc_on_order_fills=false, slippage=0,commission_type=strategy.commission.percent,commission_value=0.023)
strat_dir_input = input(title="Strategy Direction", defval="all", options=["long", "short", "all"])
strat_dir_value = strat_dir_input == "long" ? strategy.direction.long : strat_dir_input == "short" ? strategy.direction.short : strategy.direction.all
strategy.risk.allow_entry_in(strat_dir_value)
//////////////////////////////////////////////////////////////////////
// Testing Start dates
testStartYear = input(2016, "Backtest Start Year")
testStartMonth = input(1, "Backtest Start Month")
testStartDay = input(1, "Backtest Start Day")
testPeriodStart = timestamp(testStartYear,testStartMonth,testStartDay,0,0)
//Stop date if you want to use a specific range of dates
testStopYear = input(2030, "Backtest Stop Year")
testStopMonth = input(12, "Backtest Stop Month")
testStopDay = input(30, "Backtest Stop Day")
testPeriodStop = timestamp(testStopYear,testStopMonth,testStopDay,0,0)

stoch_upper_input = input(88, "Stoch Upper Threshold", type=input.float)
stoch_lower_input = input(5, "Stoch Lower Threshold", type=input.float)
sl = input(0.7, "SL %", type=input.float, step=0.1)
tp = input(2.1, "TP %", type=input.float, step=0.1)
// slowEMA = ema(close, slowEMA_input)

// vwap = vwap(close)
// rsi = rsi(close, rsi_input)


// stoch rsi
smoothK = 3
smoothD = 3
lengthRSI = 14
lengthStoch = 14
rsi1 = rsi(close, 14)
k = sma(stoch(rsi1, rsi1, rsi1, lengthStoch), smoothK)
d = sma(k, smoothD)

testPeriod() =>
    time >= testPeriodStart and time <= testPeriodStop ? true : false
// Component Code Stop
//////////////////////////////////////////////////////////////////////
//INPUT
src = input(close, title="Source")
modeSwitch = input("Hma", title="Hull Variation", options=["Hma", "Thma", "Ehma"])
length = input(180, title="Length(180-200 for floating S/R , 55 for swing entry)")
switchColor = input(true, "Color Hull according to trend?")
candleCol = input(false,title="Color candles based on Hull's Trend?")
visualSwitch  = input(true, title="Show as a Band?")
thicknesSwitch = input(1, title="Line Thickness")
transpSwitch = input(40, title="Band Transparency",step=5)

//FUNCTIONS
//HMA
HMA(_src, _length) =>  wma(2 * wma(_src, _length / 2) - wma(_src, _length), round(sqrt(_length)))
//EHMA    
EHMA(_src, _length) =>  ema(2 * ema(_src, _length / 2) - ema(_src, _length), round(sqrt(_length)))
//THMA    
THMA(_src, _length) =>  wma(wma(_src,_length / 3) * 3 - wma(_src, _length / 2) - wma(_src, _length), _length)
    
//SWITCH
Mode(modeSwitch, src, len) =>
      modeSwitch == "Hma"  ? HMA(src, len) :
      modeSwitch == "Ehma" ? EHMA(src, len) : 
      modeSwitch == "Thma" ? THMA(src, len/2) : na
      
//OUT
HULL = Mode(modeSwitch, src, length)
MHULL = HULL[0]
SHULL = HULL[2]

//COLOR
hullColor = switchColor ? (HULL > HULL[2] ? #00ff00 : #ff0000) : #ff9800

//PLOT
///< Frame
Fi1 = plot(MHULL, title="MHULL", color=hullColor, linewidth=thicknesSwitch, transp=50)
Fi2 = plot(visualSwitch ? SHULL : na, title="SHULL", color=hullColor, linewidth=thicknesSwitch, transp=50)
///< Ending Filler
fill(Fi1, Fi2, title="Band Filler", color=hullColor, transp=transpSwitch)
///BARCOLOR
barcolor(color = candleCol ? (switchColor ? hullColor : na) : na)

bgcolor(color = k < stoch_lower_input  and crossover(k, d) ? color.green : na)
bgcolor(color = d > stoch_upper_input and crossover(d, k) ? color.red : na)

notInTrade = strategy.position_size == 0

if notInTrade and HULL[0] > HULL[2] and testPeriod() and k < stoch_lower_input and crossover(k, d)
// if HULL[0] > HULL[2] and testPeriod()
    stopLoss = close * (1 - sl / 100) 
    profit25 = close * (1 + (tp / 100) * 0.25)
    profit50 = close * (1 + (tp / 100) * 0.5)
    takeProfit = close * (1 + tp / 100)
    
    
    strategy.entry("long", strategy.long, alert_message="buy")
    strategy.exit("exit long 25%", "long", stop=stopLoss, limit=profit25, qty_percent=25, alert_message="profit_25")
    strategy.exit("exit long 50%", "long", stop=stopLoss, limit=profit50, qty_percent=25, alert_message="profit_50")
    strategy.exit("exit long", "long", stop=stopLoss, limit=takeProfit)
    
    // line.new(bar_index, profit25, bar_index + 4, profit25, color=color.green)
    // line.new(bar_index, profit50, bar_index + 4, profit50, color=color.green)
    // box.new(bar_index, stopLoss, bar_index + 4, close, border_color=color.red, bgcolor=color.new(color.red, 80))
    // box.new(bar_index, close, bar_index + 4, takeProfit, border_color=color.green, bgcolor=color.new(color.green, 80))

    
if notInTrade and HULL[0] < HULL[2] and testPeriod() and d > stoch_upper_input and crossover(d, k)
// if HULL[0] < HULL[2] and testPeriod()
    stopLoss = close * (1 + sl / 100)
    profit25 = close * (1 - (tp / 100) * 0.25)
    profit50 = close * (1 - (tp / 100) * 0.5)
    takeProfit = close * (1 - tp / 100)


    strategy.entry("short", strategy.short, alert_message="sell")
    strategy.exit("exit short 25%", "short", stop=stopLoss, limit=profit25, qty_percent=25, alert_message="profit_25")
    strategy.exit("exit short 50%", "short", stop=stopLoss, limit=profit50, qty_percent=25, alert_message="profit_50")
    strategy.exit("exit short", "short", stop=stopLoss, limit=takeProfit)
    
    // line.new(bar_index, profit25, bar_index + 4, profit25, color=color.green)
    // line.new(bar_index, profit50, bar_index + 4, profit50, color=color.green)
    // box.new(bar_index, stopLoss, bar_index + 4, close, border_color=color.red, bgcolor=color.new(color.red, 80))
    // box.new(bar_index, close, bar_index + 4, takeProfit, border_color=color.green, bgcolor=color.new(color.green, 80))

// var table winrateDisplay = table.new(position.bottom_right, 1, 1)
// table.cell(winrateDisplay, 0, 0, "Winrate: " + tostring(strategy.wintrades / strategy.closedtrades * 100, '#.##')+" %", text_color=color.white)

More