Alternating Timeframe Parabolic SAR Strategy

Overview
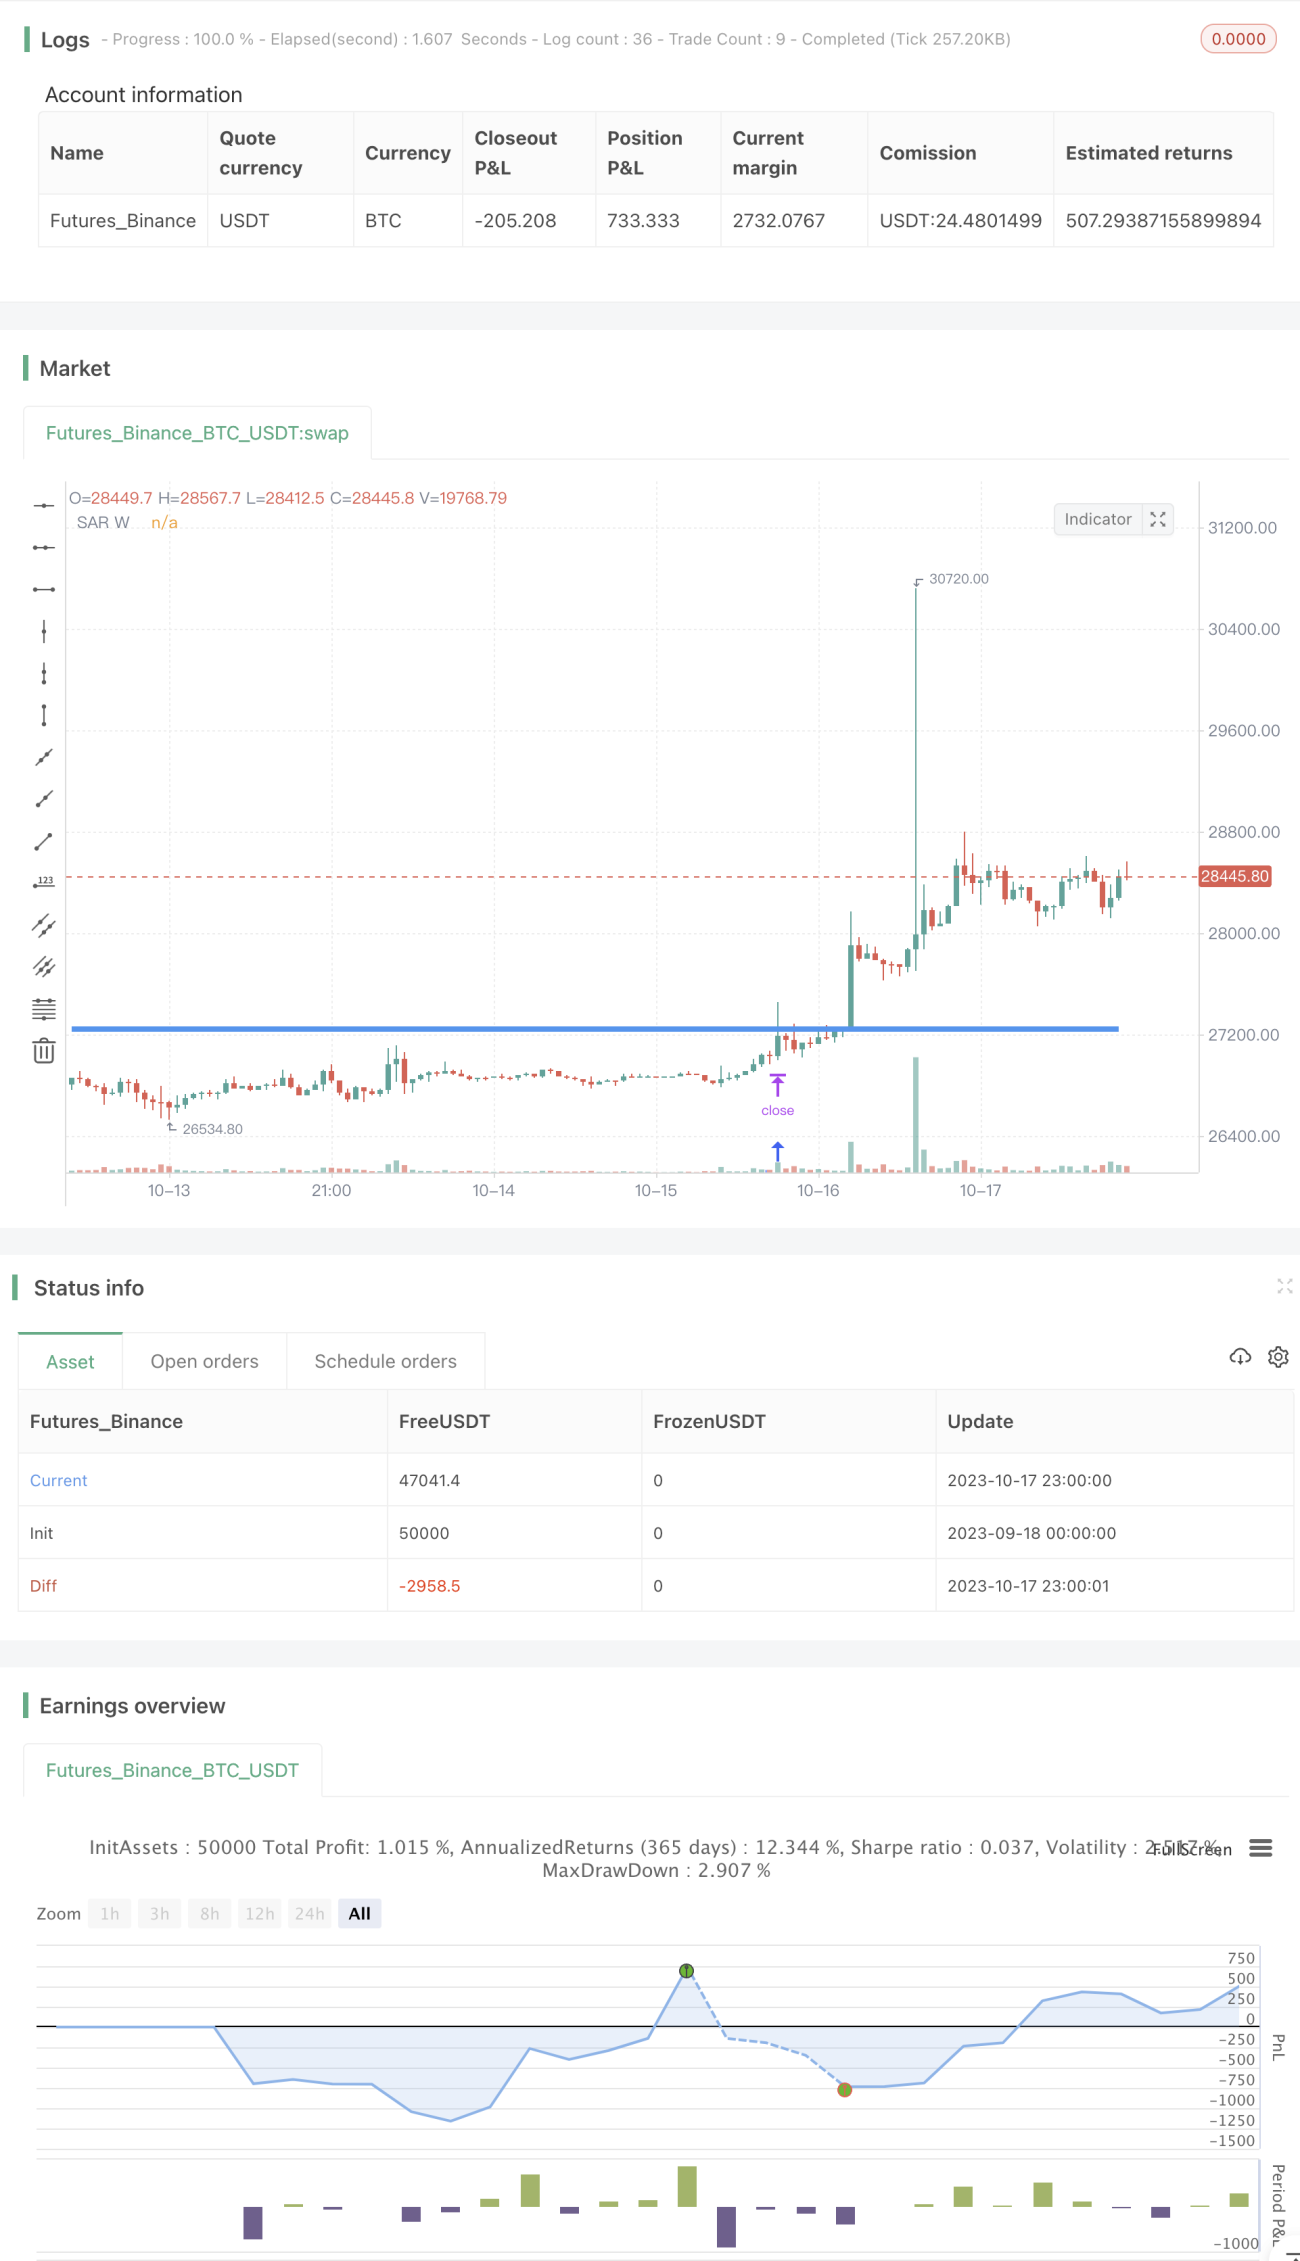
The core idea of this strategy is to use the Parabolic SAR, one of the Momentum Indicators, alternately across different timeframes to capture trend reversals in the market. The strategy monitors Parabolic SAR signals simultaneously on multiple timeframes, and enters a corresponding long or short position once a SAR signal is triggered on a higher timeframe.
Strategy Logic
Firstly, the strategy calculates Parabolic SAR values separately on different timeframes (15m, D, W, M).
Secondly, the strategy monitors the weekly SAR value. It goes long when the weekly SAR rises above the recent high, and goes short when the weekly SAR falls below the recent low.
Finally, the strategy uses the weekly SAR as the stop loss. Specifically, if already long, the weekly SAR is set as the stop loss for that long position; if already short, the weekly SAR is set as the stop loss for that short position.
This way, the strategy enters based on signals from higher timeframes, and stops out on lower timeframes. Monitoring weekly SAR signals can more accurately identify trend reversals, while stopping out on 15m SAR can realize quick cut losses to avoid excessive drawdowns when reversals come.
Advantage Analysis
This Parabolic SAR alternating timeframe strategy has the following edges:
-
Utilizes the advantages of SAR on different timeframes. Weekly SAR can accurately identify trend reversals and reduce whipsaw losses; 15m SAR allows quick stop loss management.
-
High flexibility. SAR parameters can be adjusted for different products and market conditions to optimize strategy performance.
-
Low trading frequency. Only enters on signals from higher timeframe SAR, avoiding overtrading.
-
High capital utilization efficiency. Deploys capital only when high probability reversal is identified, avoiding capital sitting idle.
-
Easy risk control. Adopting fixed stop loss points allows clear calculation of risk exposure for each position.
Risk Analysis
This strategy also has some risks:
-
Improper SAR parameter setting may lead to stop loss being too wide or too tight, thus impacting strategy performance.
-
Sharp price spikes may directly penetrate the stop loss level, leading to large losses.
-
Relying solely on SAR signals may miss other statistically profitable opportunities during trends.
-
Conflicting signals may arise from SAR on different timeframes. Signal priority needs to be handled.
-
Improper timeframe selection, too much noise on lower periods or lag in identifying reversals on higher periods, may both impact strategy efficacy.
Optimization Directions
The strategy can be improved in the following aspects:
-
Optimize SAR parameters to reduce whipsaw occurrences. Multiple backtests can be run to find optimal parameter combinations.
-
Add stop loss strategies like trailing stop, staggered stop loss etc to further control single trade loss.
-
Incorporate other indicators like MACD, KDJ to find more evidence for trend reversals, reducing trading errors.
-
Add capital management strategies like fixed fractional position sizing, fixed risk-reward ratio etc to size each position and control overall strategy risk.
-
Optimize timeframe combinations by testing strategy performance under different period settings to find best match.
Conclusion
This strategy utilizes Parabolic SAR alternately across timeframes, identifying reversal points on higher periods and stopping out on lower periods, achieving synergistic effect. It effectively reduces whipsaw trades and risk from false breakouts. With further enhancements like parameter optimization, stop loss strategies and capital management, outstanding strategy results can be achieved.
- 1