Moving Average Trend Following Golden Cross Long Strategy

Overview
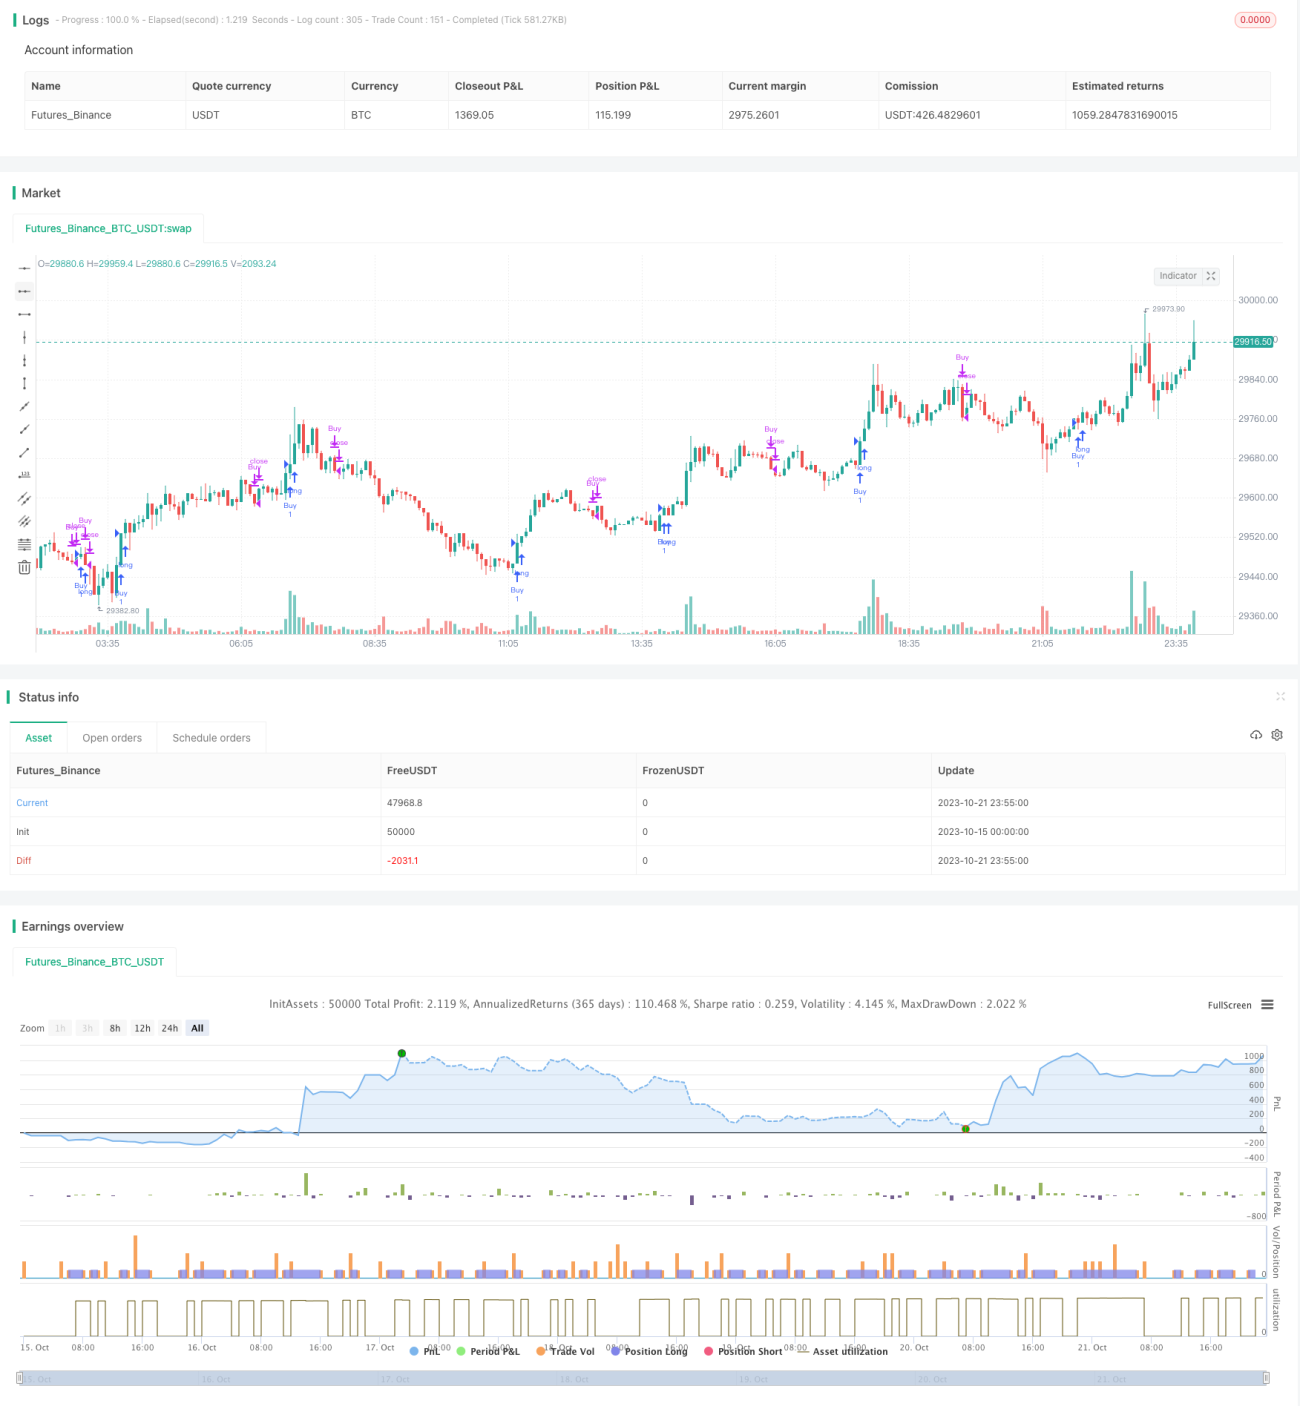
This strategy combines moving average indicators and the MACD indicator to design a relatively conservative long strategy. It mainly uses the 200-day simple moving average to judge the trend, and combines the 20-day exponential moving average and MACD golden cross to select buying opportunities. In an uptrend, it only buys when there is a MACD golden cross and stops loss when there is a MACD dead cross. In a downtrend, it will only buy when the price is above the 20-day EMA and there is a MACD golden cross, and stop loss when there is a MACD dead cross. This dual confirmation mechanism can effectively avoid frequent trading in a volatile market.
Strategy Logic
Firstly, the strategy uses the 200-day simple moving average (SMA) to judge the current price trend. If the closing price is above SMA, the trend is judged to be rising. If the closing price is below SMA, the trend is judged to be falling.
Secondly, in an uptrend, the strategy ignores the 20-day exponential moving average (EMA) condition and only sends a buy signal when the MACD fast line crosses above the slow line (MACD golden cross). It holds the long position as long as the MACD stays golden crossed. When the MACD fast line crosses below the slow line (MACD dead cross), it stops loss.
In a downtrend, the strategy becomes more conservative. It only sends a buy signal when the closing price crosses above the 20-day EMA and there is a MACD golden cross, requiring dual confirmation. It still stops loss on MACD dead cross.
Through this mechanism, the strategy adopts a more aggressive approach when the trend is clear (price is above or below the 200-day SMA). When the price is in a range, it takes a more cautious approach, effectively avoiding false signals.
Advantages
-
The strategy combines trend judgment and dual confirmation to filter noise and avoid false signals, reducing unnecessary trades.
-
It timely follows the trend when the trend is clear, and adopts a cautious attitude when the trend is unclear, reducing losses.
-
Combining moving averages and MACD makes trading signals more reliable.
-
The strategy is simple to implement, suitable for investors at all levels.
-
The fixed stop loss mechanism effectively controls single trade loss.
Risks
-
The strategy relies heavily on technical indicators and cannot adapt to black swan events.
-
The dual confirmation may cause missed buying opportunities sometimes.
-
MACD has lagging issues which may delay trading signals.
-
Improper stop loss setting may lead to larger losses.
-
The 200-day SMA may not accurately determine long term trends.
-
Moving averages as filters may generate trivial trading signals.
Optimization
-
Consider combining other indicators like KDJ, Bollinger Bands to make signals more accurate.
-
Test other long term moving averages like 120-day EMA to better determine long term trends.
-
Optimize moving average periods to find the best parameter combination.
-
Incorporate take profit strategies, not just stop loss, to lock in more profits.
-
Adjust moving average parameters for different markets to improve adaptability.
-
Consider machine learning algorithms to optimize parameters by training models on historical data.
Summary
The strategy integrates the advantages of moving averages and MACD, achieving good risk control while remaining relatively simple. By judging the trend and requiring dual confirmation, it can filter out noise effectively. But the strategy also has some limitations and needs further optimization and adaptability to black swan events. Overall, it provides conservative investors with a robust reference solution.
- 1