RSI Trend Reversal Strategy

Author: ChaoZhang, Date: 2023-10-23 17:04:13
Tags:

img

Overview

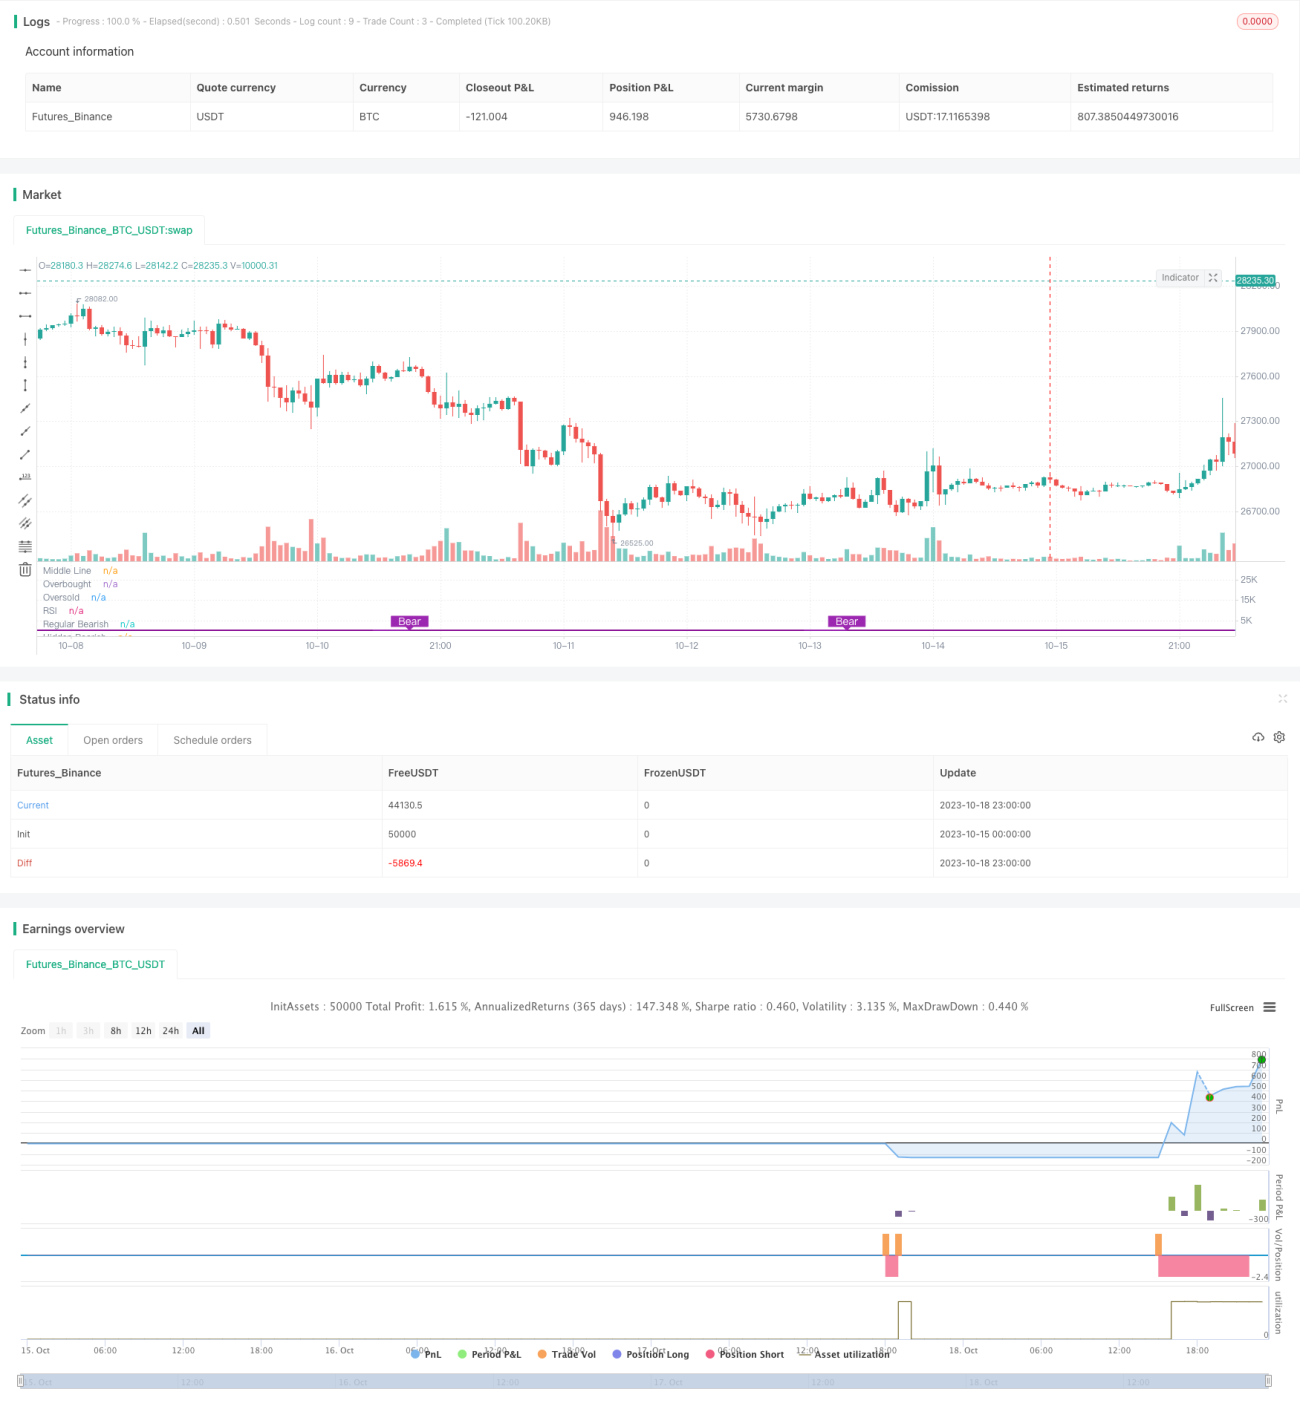
The RSI Trend Reversal strategy utilizes the reversal signals of the RSI indicator to identify potential trend reversal points and enter long or short trades. This strategy combines price reversal and RSI reversal signals to effectively filter out false reversal signals.

Strategy Logic

This strategy is based on the combination of RSI reversal signals and price reversal signals, mainly including four situations:

  1. Regular Bullish Reversal: When RSI forms a higher low (meaning RSI trend reverses from up to down) and price forms a lower low (meaning price trend reverses from down to up), a regular bullish reversal signal is generated.

  2. Hidden Bullish Reversal: When RSI forms a lower low (meaning RSI trend continues from up to down) but price forms a higher low (meaning price trend reverses from down to up), a hidden bullish reversal signal is generated.

  3. Regular Bearish Reversal: When RSI forms a lower high (meaning RSI trend reverses from down to up) and price forms a higher high (meaning price trend reverses from up to down), a regular bearish reversal signal is generated.

  4. Hidden Bearish Reversal: When RSI forms a higher high (meaning RSI trend continues from down to up) but price forms a lower high (meaning price trend reverses from up to down), a hidden bearish reversal signal is generated.

This combines both RSI reversal and price reversal signals to generate trading signals, avoiding false signals from relying merely on RSI or price reversals alone, making the strategy more robust.

Advantage Analysis

The RSI Trend Reversal strategy has the following advantages:

  1. Combining RSI and price reversal filters out many false reversal signals and improves signal quality. RSI alone is not completely reliable in identifying reversals, requiring confirmation from price.

  2. Identifying hidden bullish and bearish patterns, which often precede powerful price trends, allows early entry.

  3. Customizable RSI parameters and lookback periods can be adjusted for different markets, offering flexibility.

  4. Visualizing indicator patterns and signals gives intuitive market state judgment.

  5. Simple and clear strategy logic makes it easy to understand and implement for algo trading.

Risk Analysis

The RSI Trend Reversal strategy also has the following risks:

  1. The combined RSI and price reversal may still have occasional misjudgments. Indicators are statistical measurements of price and cannot be fully relied on.

  2. Hidden bullish and bearish patterns are hard to identify and opportunities could be missed without experience.

  3. Improper lookback period settings may lead to missing reversal points or lagging judgments. Periods need adjusting for different markets.

  4. Stop loss strategies should be implemented to avoid loss increasing after bearish reversals.

Risks can be managed by optimizing parameters, strict stop loss, prudently taking hidden reversal signals, etc.

Optimization Directions

The RSI Trend Reversal strategy can be optimized in the following aspects:

  1. Adjust RSI parameters and test sensitivity to find optimal RSI period for different markets.

  2. Optimize lookback period parameters to balance catching reversals early and preventing false signals.

  3. Add volume analysis such as detecting high volume unwinding causing price reversals.

  4. Combine other indicator signals like MACD, Bollinger Bands to improve judgment accuracy.

  5. Add stop loss strategies to limit loss size. Can set stop loss after price breaks new highs/lows.

  6. Refine strategy logic based on backtest results to improve profit factors. Adjust logic relationships and find optimal combinations.

Summary

The RSI Trend Reversal strategy identifies potential trend turning points by combining RSI reversals and price reversals. It makes good use of RSI’s trend judging capability while filtering false signals with price information. The strategy has simple and clear logic that is easy to implement. Parameters and stop loss can be optimized to manage risks and further improve performance. Overall, the RSI Trend Reversal strategy is a reliable and practical short-term trading strategy.


/*backtest
start: 2023-10-15 00:00:00
end: 2023-10-19 00:00:00
period: 1h
basePeriod: 15m
exchanges: [{"eid":"Futures_Binance","currency":"BTC_USDT"}]
*/

//@version=4
//study(title="Divergence Indicator", format=format.price)
strategy(title="RSI Divergence Indicator", overlay=false,pyramiding=1, default_qty_value=2,   default_qty_type=strategy.fixed, initial_capital=10000, currency=currency.USD)

len = input(title="RSI Period", minval=1, defval=5)
src = input(title="RSI Source", defval=close)
lbR = input(title="Pivot Lookback Right", defval=5)
lbL = input(title="Pivot Lookback Left", defval=5)
rangeUpper = input(title="Max of Lookback Range", defval=60)
rangeLower = input(title="Min of Lookback Range", defval=5)
plotBull = input(title="Plot Bullish", defval=true)
plotHiddenBull = input(title="Plot Hidden Bullish", defval=true)
plotBear = input(title="Plot Bearish", defval=true)
plotHiddenBear = input(title="Plot Hidden Bearish", defval=false)

bearColor = color.purple
bullColor = color.green
hiddenBullColor = color.new(color.green, 80)
hiddenBearColor = color.new(color.red, 80)
textColor = color.white
noneColor = color.new(color.white, 100)

osc = rsi(src, len)

plot(osc, title="RSI", linewidth=2, color=#8D1699)
hline(50, title="Middle Line", linestyle=hline.style_dotted)
obLevel = hline(70, title="Overbought", linestyle=hline.style_dotted)
osLevel = hline(30, title="Oversold", linestyle=hline.style_dotted)
fill(obLevel, osLevel, title="Background", color=#9915FF, transp=90)

plFound = na(pivotlow(osc, lbL, lbR)) ? false : true
phFound = na(pivothigh(osc, lbL, lbR)) ? false : true

_inRange(cond) =>
    bars = barssince(cond == true)
    rangeLower <= bars and bars <= rangeUpper

//------------------------------------------------------------------------------
// Regular Bullish

// Osc: Higher Low
oscHL = osc[lbR] > valuewhen(plFound, osc[lbR], 1) and _inRange(plFound[1])

// Price: Lower Low
priceLL = low[lbR] < valuewhen(plFound, low[lbR], 1)

bullCond = plotBull and priceLL and oscHL and plFound

plot(
	 plFound ? osc[lbR] : na,
	 offset=-lbR,
	 title="Regular Bullish",
	 linewidth=2,
	 color=(bullCond ? bullColor : noneColor),
	 transp=0
	 )


plotshape(
	 bullCond ? osc[lbR] : na,
	 offset=-lbR,
	 title="Regular Bullish Label",
	 text=" Bull ",
	 style=shape.labelup,
	 location=location.absolute,
	 color=bullColor,
	 textcolor=textColor,
	 transp=0
	 )

//------------------------------------------------------------------------------
// Hidden Bullish

// Osc: Lower Low
oscLL = osc[lbR] < valuewhen(plFound, osc[lbR], 1) and _inRange(plFound[1])

// Price: Higher Low
priceHL = low[lbR] > valuewhen(plFound, low[lbR], 1)

hiddenBullCond = plotHiddenBull and priceHL and oscLL and plFound

plot(
	 plFound ? osc[lbR] : na,
	 offset=-lbR,
	 title="Hidden Bullish",
	 linewidth=2,
	 color=(hiddenBullCond ? hiddenBullColor : noneColor),
	 transp=0
	 )

plotshape(
	 hiddenBullCond ? osc[lbR] : na,
	 offset=-lbR,
	 title="Hidden Bullish Label",
	 text=" H Bull ",
	 style=shape.labelup,
	 location=location.absolute,
	 color=bullColor,
	 textcolor=textColor,
	 transp=0
	 )

longCondition=bullCond or hiddenBullCond
//? osc[lbR] : na  
//hiddenBullCond
strategy.entry(id="RSIDivLE", long=true,  when=longCondition)


//------------------------------------------------------------------------------
// Regular Bearish

// Osc: Lower High
oscLH = osc[lbR] < valuewhen(phFound, osc[lbR], 1) and _inRange(phFound[1])

// Price: Higher High
priceHH = high[lbR] > valuewhen(phFound, high[lbR], 1)

bearCond = plotBear and priceHH and oscLH and phFound

plot(
	 phFound ? osc[lbR] : na,
	 offset=-lbR,
	 title="Regular Bearish",
	 linewidth=2,
	 color=(bearCond ? bearColor : noneColor),
	 transp=0
	 )

plotshape(
	 bearCond ? osc[lbR] : na,
	 offset=-lbR,
	 title="Regular Bearish Label",
	 text=" Bear ",
	 style=shape.labeldown,
	 location=location.absolute,
	 color=bearColor,
	 textcolor=textColor,
	 transp=0
	 )

//------------------------------------------------------------------------------
// Hidden Bearish

// Osc: Higher High
oscHH = osc[lbR] > valuewhen(phFound, osc[lbR], 1) and _inRange(phFound[1])

// Price: Lower High
priceLH = high[lbR] < valuewhen(phFound, high[lbR], 1)

hiddenBearCond = plotHiddenBear and priceLH and oscHH and phFound

plot(
	 phFound ? osc[lbR] : na,
	 offset=-lbR,
	 title="Hidden Bearish",
	 linewidth=2,
	 color=(hiddenBearCond ? hiddenBearColor : noneColor),
	 transp=0
	 )

plotshape(
	 hiddenBearCond ? osc[lbR] : na,
	 offset=-lbR,
	 title="Hidden Bearish Label",
	 text=" H Bear ",
	 style=shape.labeldown,
	 location=location.absolute,
	 color=bearColor,
	 textcolor=textColor,
	 transp=0
	 )
longCloseCondition=crossover(osc,75) or bearCond
strategy.close(id="RSIDivLE",  when=longCloseCondition)

More