Triple Pattern Oscillation Trading Strategy

Overview
The Triple Pattern Oscillation Trading Strategy is a short-term trading strategy based on a combination of multiple technical indicators. It incorporates the Super Trend, SSL Hybrid Moving Average and Improved QQE to generate stable trading signals. The strategy works well with volatile trading instruments like cryptocurrencies and stocks, especially during post-breakout periods.
Principles
Entry Signals
Long Entry:
- Super Trend flipping from down to up
- Close above SSL Hybrid upper band
- Improved QQE is blue (bullish)
Short Entry:
- Super Trend flipping from up to down
- Close below SSL Hybrid lower band
- Improved QQE is red (bearish)
Exit Signals
Long Exit: Super Trend flipping from up to down
Short Exit: Super Trend flipping from down to up
Stop Loss
Options of percentage, ATR or recent highest/lowest price
Take Profit
Can set a risk-reward ratio for take profit levels
Risk Management
Option to enable position sizing based on account risk
Plotting
- Plot Super Trend line, SSL Hybrid bands
- Option for EMA line
- Plot entry, stop loss and take profit lines
- Entry arrow labels
Advantages
- Stable signals from multiple indicators
Combining Super Trend, SSL Hybrid MA and Improved QQE verifies signals across indicators, filtering false breakouts. Quality trading signals are generated.
- Suitable for oscillation trading of volatile instruments
Short-term trading approach focuses on capturing medium-term price swings. Super Trend tracks trends smoothly while SSL Hybrid identifies support/resistance levels clearly. Profitable in ranging markets.
- Flexible stop loss and take profit
Choice of percentage, ATR or recent extreme for stop loss. Risk-reward ratio sets take profit. Options suit different trading instruments and risk preferences.
- Clear plotting
Clean plotting visually displays stop loss, take profit levels. Entry arrows easy to identify.
Risks and Improvements
- Occasional minor losses
Short-term trading cannot fully avoid normal ranging market losses. Can optimize stop loss and risk management.
- False breakout risks
False breakouts may generate wrong signals. Test EMA periods to filter. Optimize trend identification parameters.
- Monitor indicator failure
Invalid indicators cause multiple false signals. Regularly check indicator validity, adjust promptly if issues found.
- Optimize backtest period
Current fixed backtest period does not match instruments' active hours. Optimize to trading sessions.
- Enhance instrument adaptability
Fine tune parameters for each instrument's data characteristics, improving win rates. Stepwise optimize parameter impact.
Conclusion
This strategy combines multiple indicators for robust signals, filtering false breakouts. It excels trading volatile cryptocurrencies and equities short-term. Numerous stop loss and take profit choices provide flexibility. Overall, stable signals are generated for medium-term range trading. Further optimizations can improve profit factor across instruments. A promising high-performance trading system worth in-depth research.
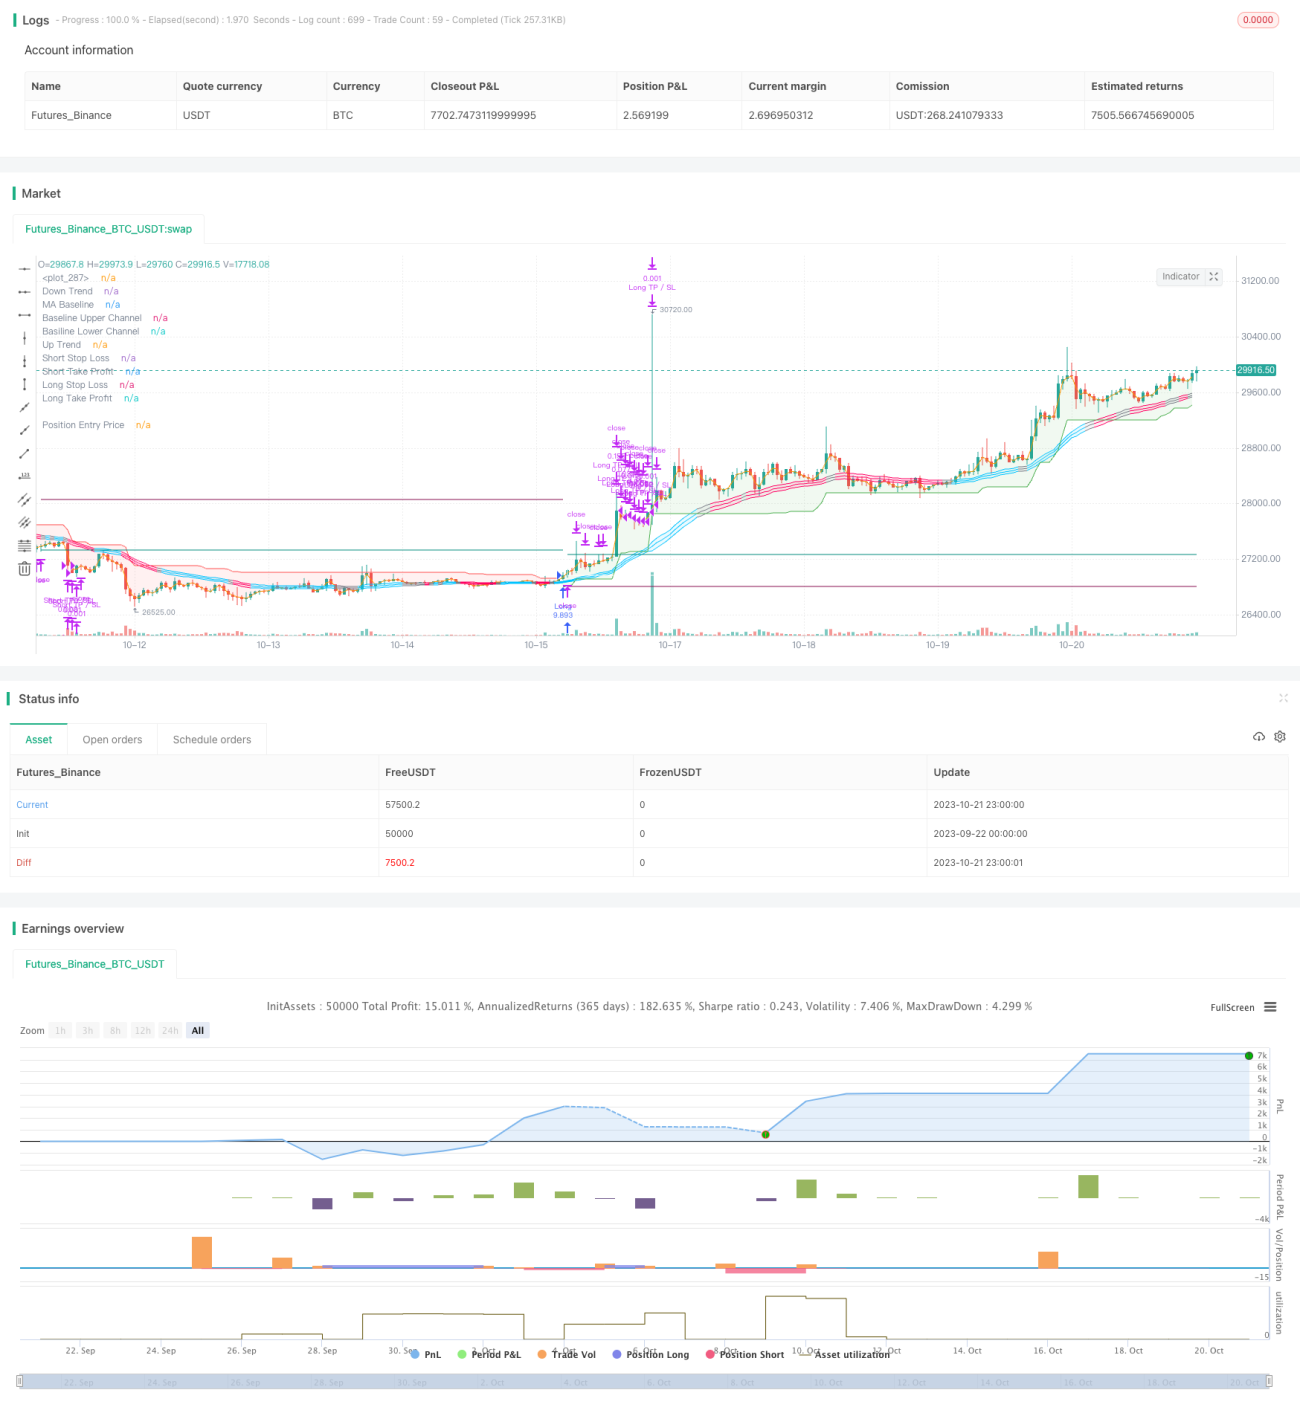
/*backtest
start: 2023-09-22 00:00:00
end: 2023-10-22 00:00:00
period: 1h
basePeriod: 15m
exchanges: [{"eid":"Futures_Binance","currency":"BTC_USDT"}]
*/

// This source code is subject to the terms of the Mozilla Public License 2.0 at https://mozilla.org/MPL/2.0/
// © fpemehd
// Thanks to myncrypto, jason5480, kevinmck100
// @version=5- 1