Dual Moving Average Reversal Strategy

Overview
This strategy mainly uses dual moving averages as buy and sell signals to profit from trend reversals. It goes long when the short-term moving average crosses above the long-term moving average, and goes short when the short-term moving average crosses below the long-term moving average. It belongs to a common trailing stop loss strategy.
Strategy Logic
The strategy first sets up two moving averages, one shorter-term 20-day MA and one longer-term 60-day MA. It then judges the crossing situations between the two MAs to determine entry.
Specifically, when the short-term MA crosses above the long-term MA, it signals an uptrend, so go long. When the short-term MA crosses below the long-term MA, it signals a downtrend, so go short.
The stop loss method after going long or short is trailing stop based on highest price and lowest price to lock in maximum profit.
The main logic of the code is:
- Calculate the 20-day EMA and 60-day EMA
- Judge if 20-day EMA crosses above 60-day EMA, if yes go long
- Judge if 20-day EMA crosses below 60-day EMA, if yes go short
- After going long, set stop loss at 3% below highest price
- After going short, set stop loss at 3% above lowest price
- Keep adjusting stop loss when in positions
Advantage Analysis
The advantages of this strategy are:
- Simple logic easy to implement.
- Dual MA can effectively filter false breaks.
- Trailing stop locks in maximum profit.
- Can timely capture signals when trend changes.
- Proper drawdown control, relatively stable.
Risk Analysis
There are also some risks:
- Frequent crosses between MAs when trend is unclear, leading to overtrading losses.
- Improper stop loss setting can be too loose or too aggressive.
- Wrong parameter settings like period length may miss key signals.
- High trading costs erodes profit margin.
To address the risks:
- Adopt filters when trend is unclear to avoid blind trading.
- Test and optimize stop loss range for proper setting.
- Find optimum parameters through backtest and tuning.
- Reduce position size to lower trading costs.
Optimization Ideas
The strategy can be further optimized in the following areas:
-
Add other filters like RSI for multi-condition entry, avoiding false breaks.
-
Optimize MA periods to find best parameter mix. Can test different periods by incremental walk forward.
-
Optimize stop loss range through backtest calculation to find optimum range. Can also use dynamic stop loss.
-
Set re-entry logic after stop loss exit to reduce trade frequency.
-
Combine with trend indicator to pause trading when trend is unclear.
-
Add position sizing and dynamic stop loss based on market conditions.
Summary
In summary, the dual MA reversal strategy is simple and practical overall, identifying trend turning points through dual MA crossovers. But there are risks that need parameter tuning, stop loss optimization, and adding filters to maximize strategy efficacy. With meticulous optimization and disciplined risk management, it can become a steady profit-bearing swing trading strategy.
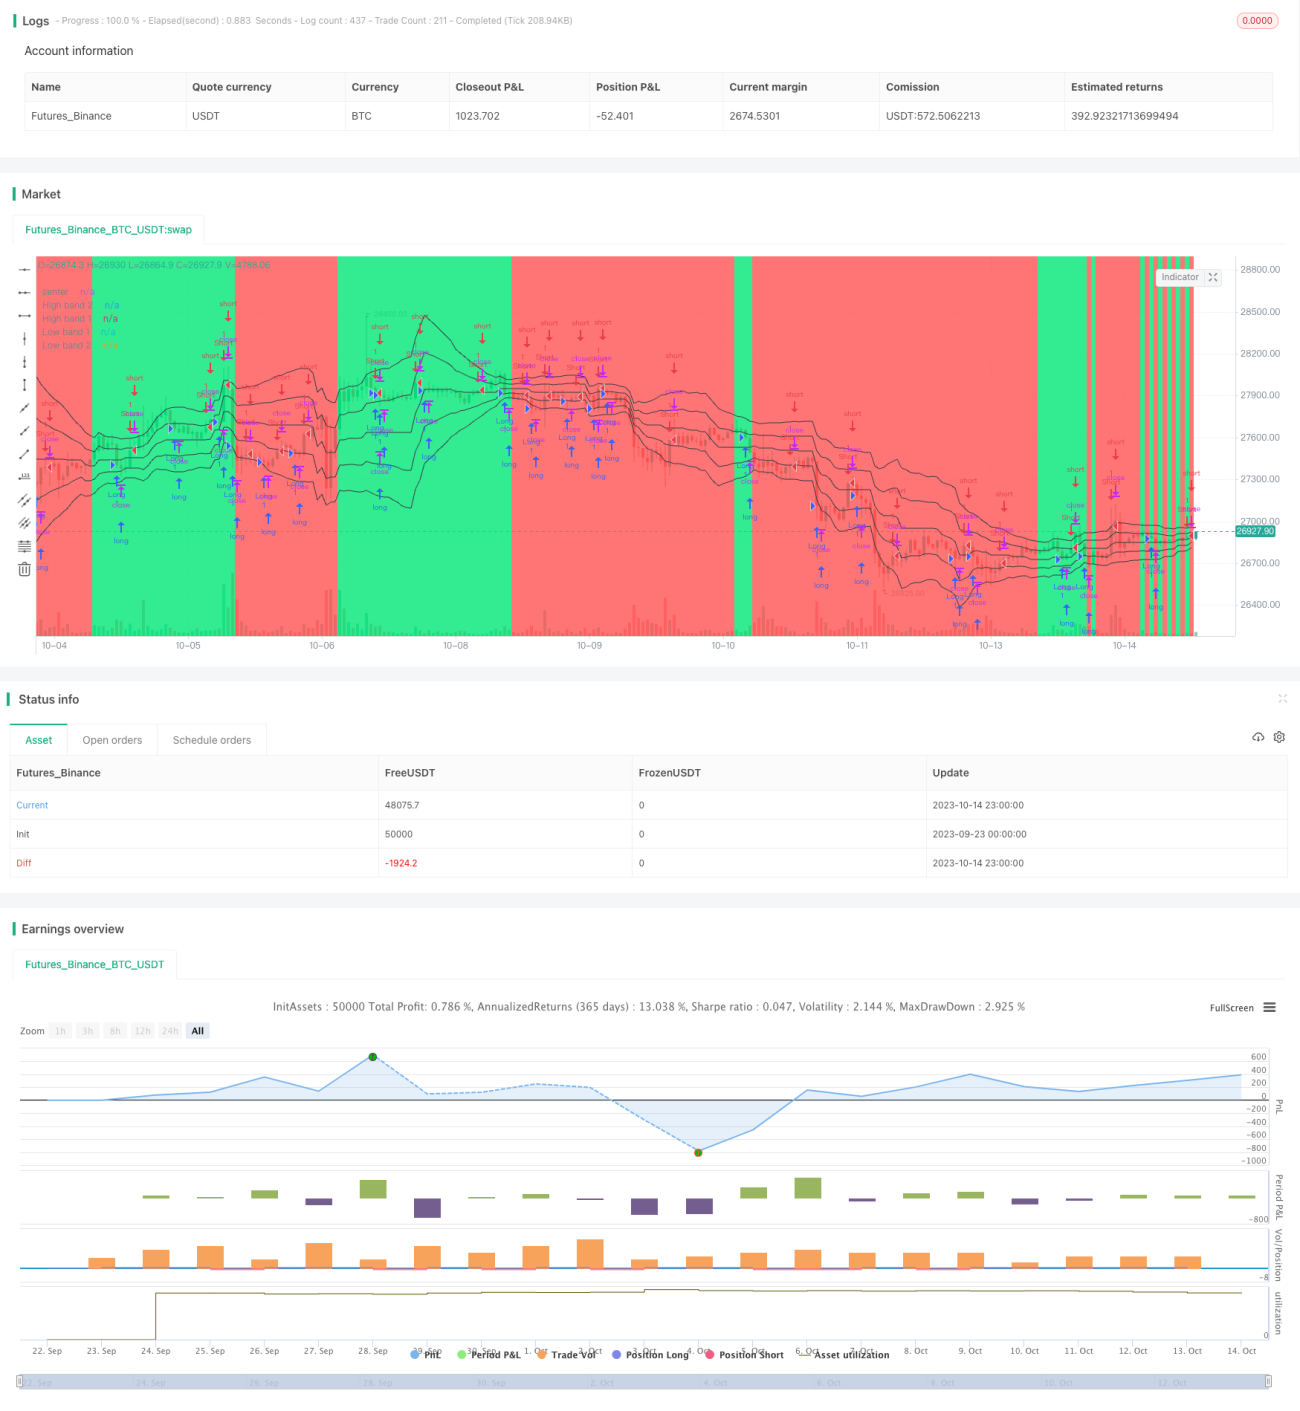
/*backtest
start: 2023-09-23 00:00:00
end: 2023-10-15 00:00:00
period: 1h
basePeriod: 15m
exchanges: [{"eid":"Futures_Binance","currency":"BTC_USDT"}]
*/


//@version=2
strategy("Noro's Bands Scalper Strategy v1.4", shorttitle = "Scalper str 1.4", overlay=true, default_qty_type = strategy.percent_of_equity, default_qty_value=100.0, pyramiding=0)
- 1