Trend Following Buy Dip Sell Peak Strategy

Overview
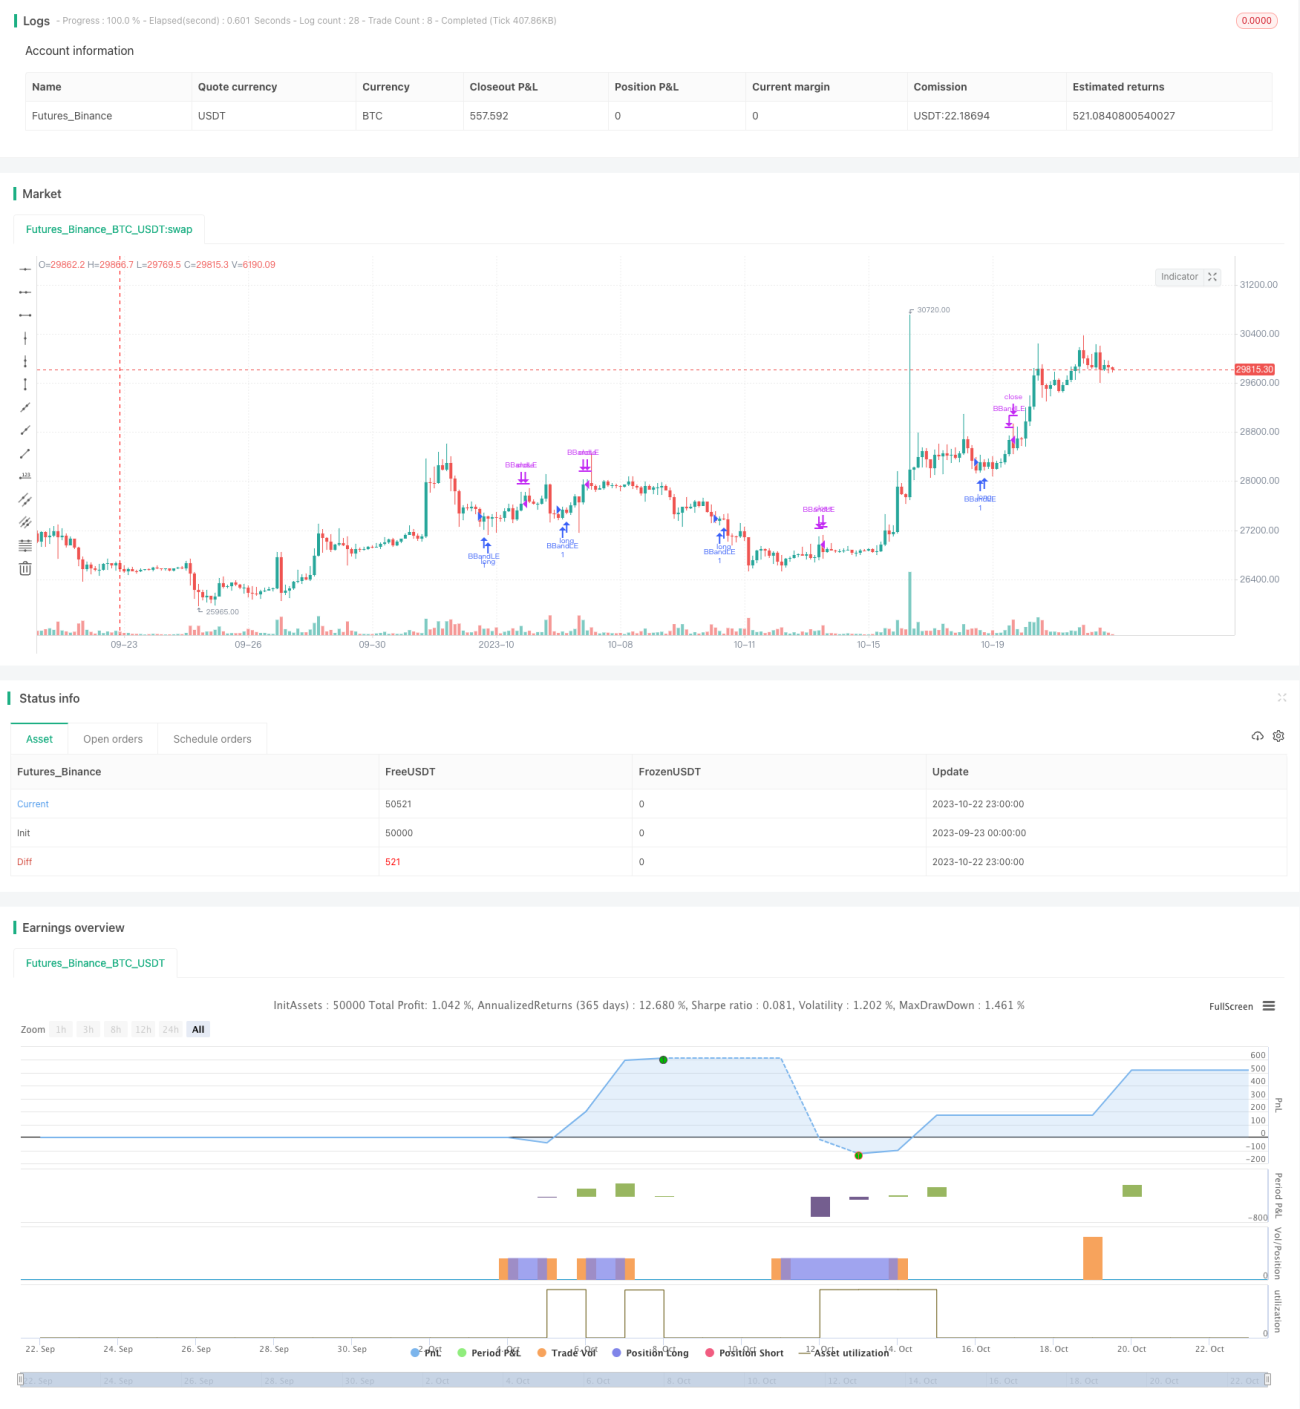
This strategy implements automated trend following trading by calculating Bollinger Bands to identify dips and peaks and using long-term and short-term moving averages to determine the overall trend direction. The core idea is to buy dips and sell peaks according to the prevailing trend.
Strategy Logic
The key components of the strategy are:
-
Calculate Bollinger Bands with upper and lower bands based on close price and standard deviation.
-
Determine long-term and short-term trend using 300-period and 20-period SMA.
-
Generate buy signal when close breaks below lower band while long SMA is above and short SMA turns up.
-
Generate sell signal when close breaks above upper band while long SMA is below and short SMA turns down.
-
Use OCO orders to set stop loss and take profit.
With this design, the strategy can automatically identify dip buying and peak selling opportunities along the major trend direction.
Advantage Analysis
The advantages of this strategy include:
-
Automated trend detection without manual judgment.
-
Systematically capture dips for buying opportunities.
-
Systematically identify peak selling opportunities for profit taking.
-
Effective risk control using stop loss and take profit.
-
Filter out invalid signals to improve win rate.
-
Flexible trend following by position adjustment.
-
Clear logic and easy to understand and optimize.
Risk Analysis
The main risks to consider:
-
Inappropriate security selection could fail the trend tracking.
-
Improper parameter tuning may cause overtrading or missed trades.
-
Trend reversal from sudden events may lead to larger losses.
-
Stop loss too tight may cause excessive stops.
-
Insufficient liquidity may prevent full execution.
-
Overfitting with insufficient backtesting period.
The solutions include: select liquid stocks with clear trends; optimize parameters; watch out for news; relax stop loss; evaluate real trading volume; expand backtest period.
Optimization Directions
Some ways to optimize the strategy:
-
Optimize parameters like Bollinger period, standard deviation multiplier and moving average periods.
-
Add stop loss methods like trailing stop or moving average stop to better control risks.
-
Incorporate position sizing based on key levels to improve capital utilization efficiency.
-
Add volume filter to avoid invalid breakouts with low volume.
-
Add relative strength indicator to determine buy/sell bias.
-
Introduce machine learning for automatic parameter tuning and strategy evaluation.
-
Combine with other strategies to create multi-strategy portfolio for greater robustness.
These optimizations can further enhance the strategy's performance and stability.
Summary
The strategy offers a clear and understandable approach to systematically buy dips and sell peaks along the trend. With proper risk control, it has good profit potential. Further improvements can be made via parameter tuning, stop loss modification, position sizing, etc. The strategy serves as a solid foundation for automated trend following trading.
- 1