Trend Reversal Volatility Combination Strategy

Overview
This strategy combines a trend reversal strategy with a statistical volatility strategy to generate stronger trading signals.
How it Works
The strategy consists of two parts:
-
Trend reversal strategy
- Identify trend reversal points using 123 pattern. Specifically, go long if close has risen for 2 consecutive days and 9-day Stochastic slow line is below 50; go short if close has fallen for 2 consecutive days and 9-day Stochastic fast line is above 50.
-
Statistical volatility strategy
- Calculate 30-day statistical volatility using Extreme Value Method. Go long if volatility is above 0.5%; go short if volatility is below 0.16%.
The strategy generates a trade signal only when both strategies agree on the direction (both long or both short). Otherwise, no trade.
Advantage Analysis
The combo strategy improves signal reliability by combining two different types of strategies:
-
The 123 pattern accurately captures trend reversal points and avoids being misled by one-off price spikes.
-
The statistical volatility focuses on high-volatility, high-opportunity periods based on market movement over the past month.
By verifying each other, the two strategies combined catch key market turning points more precisely and generate more accurate trading signals.
Risk Analysis
-
123 patterns cannot fully avoid the risk of false breakouts. Erratic whipsaws may cause bad signals.
-
Statistical volatility only considers historical data and cannot predict future volatility shifts. Sudden volatility expansion or contraction can lead to bad signals.
-
Both strategies rely heavily on parameter tuning. Poor parameter settings may degrade signal quality significantly.
-
Although more reliable overall, the combo approach may miss some strong signals from individual strategies.
Improvement Areas
-
Incorporate more indicators like Bollinger Bands, KDJ to form a voting mechanism.
-
Add machine learning algorithms to determine trend reversal probabilities using more historical data.
-
Set signal strength thresholds to filter out noise.
-
Optimize parameters for different products and timeframes.
-
Add stop loss mechanisms to control risk of the combined strategy.
Conclusion
The strategy improves signal quality by combining trend reversal and statistical volatility strategies, providing more accurate trade signals around market turning points. But misinterpretation risks and parameter optimization issues remain. Further enhancements like more indicators and machine learning can lead to even more robust and reliable trading signals.
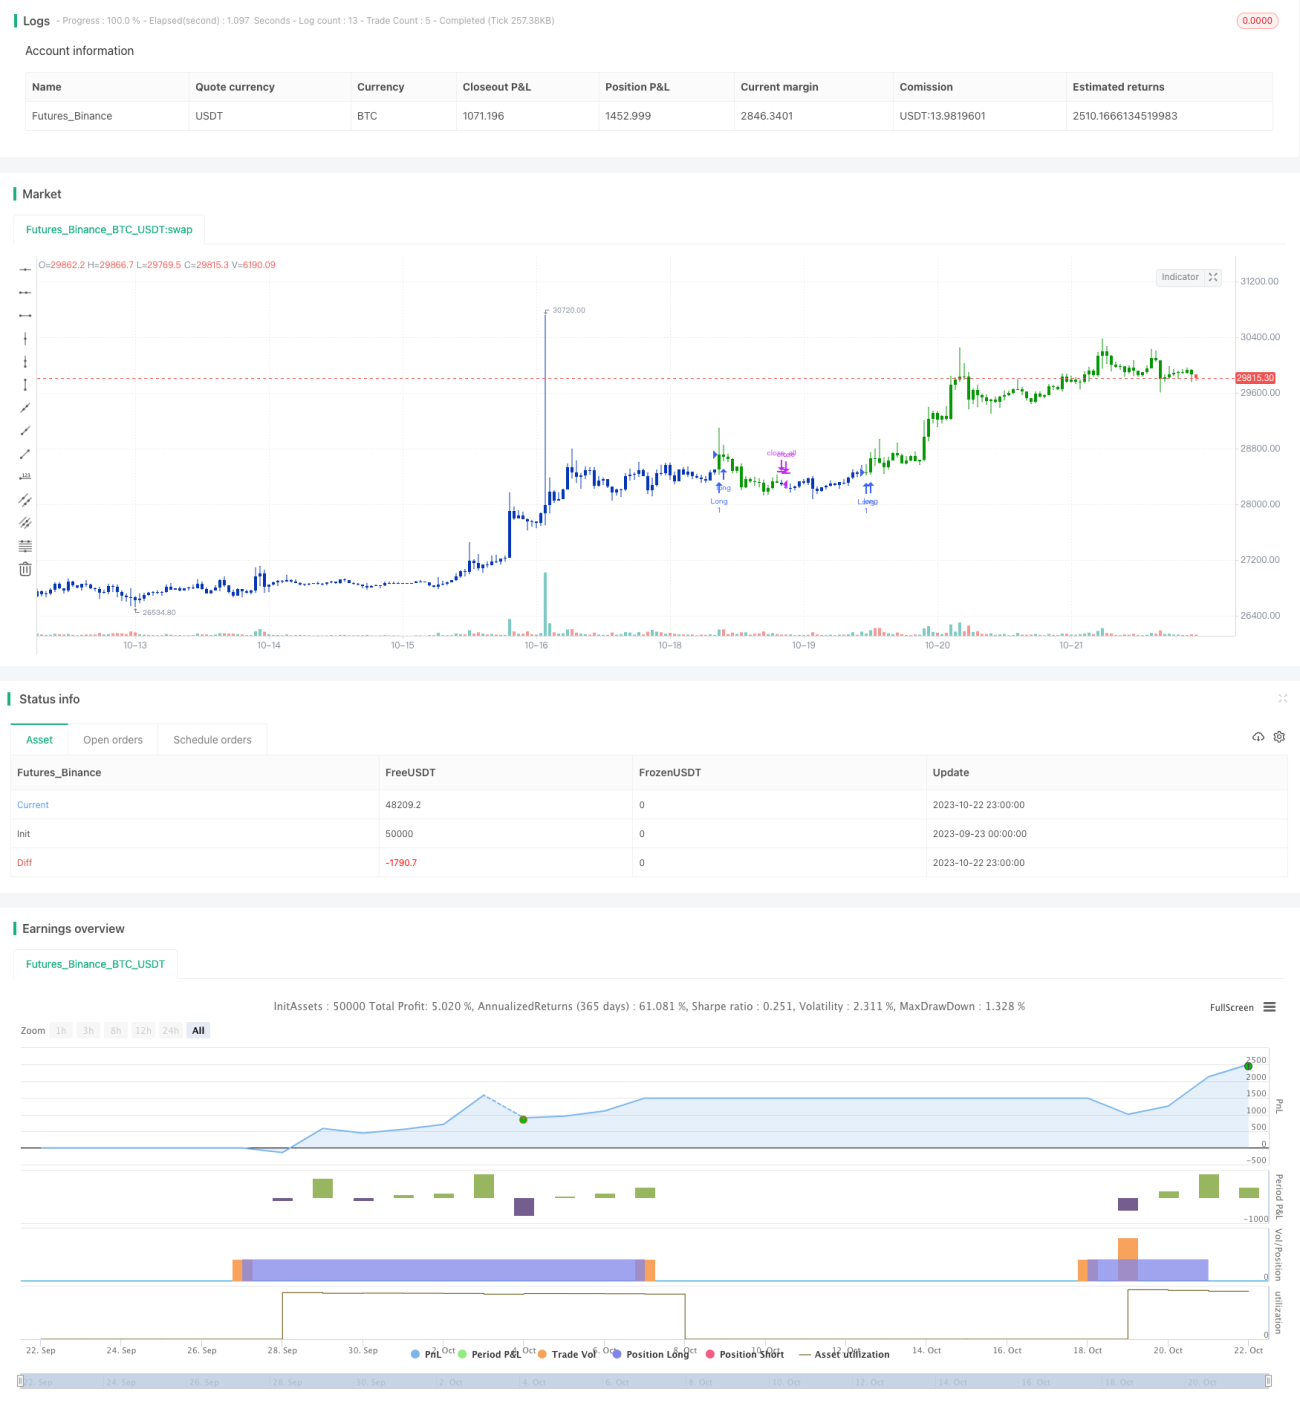
/*backtest
start: 2023-09-23 00:00:00
end: 2023-10-23 00:00:00
period: 1h
basePeriod: 15m
exchanges: [{"eid":"Futures_Binance","currency":"BTC_USDT"}]
*/

//@version=4
////////////////////////////////////////////////////////////
//  Copyright by HPotter v1.0 31/07/2021
// This is combo strategies for get a cumulative signal. - 1