Going with the Trend Moving Average Crossover Strategy

Overview
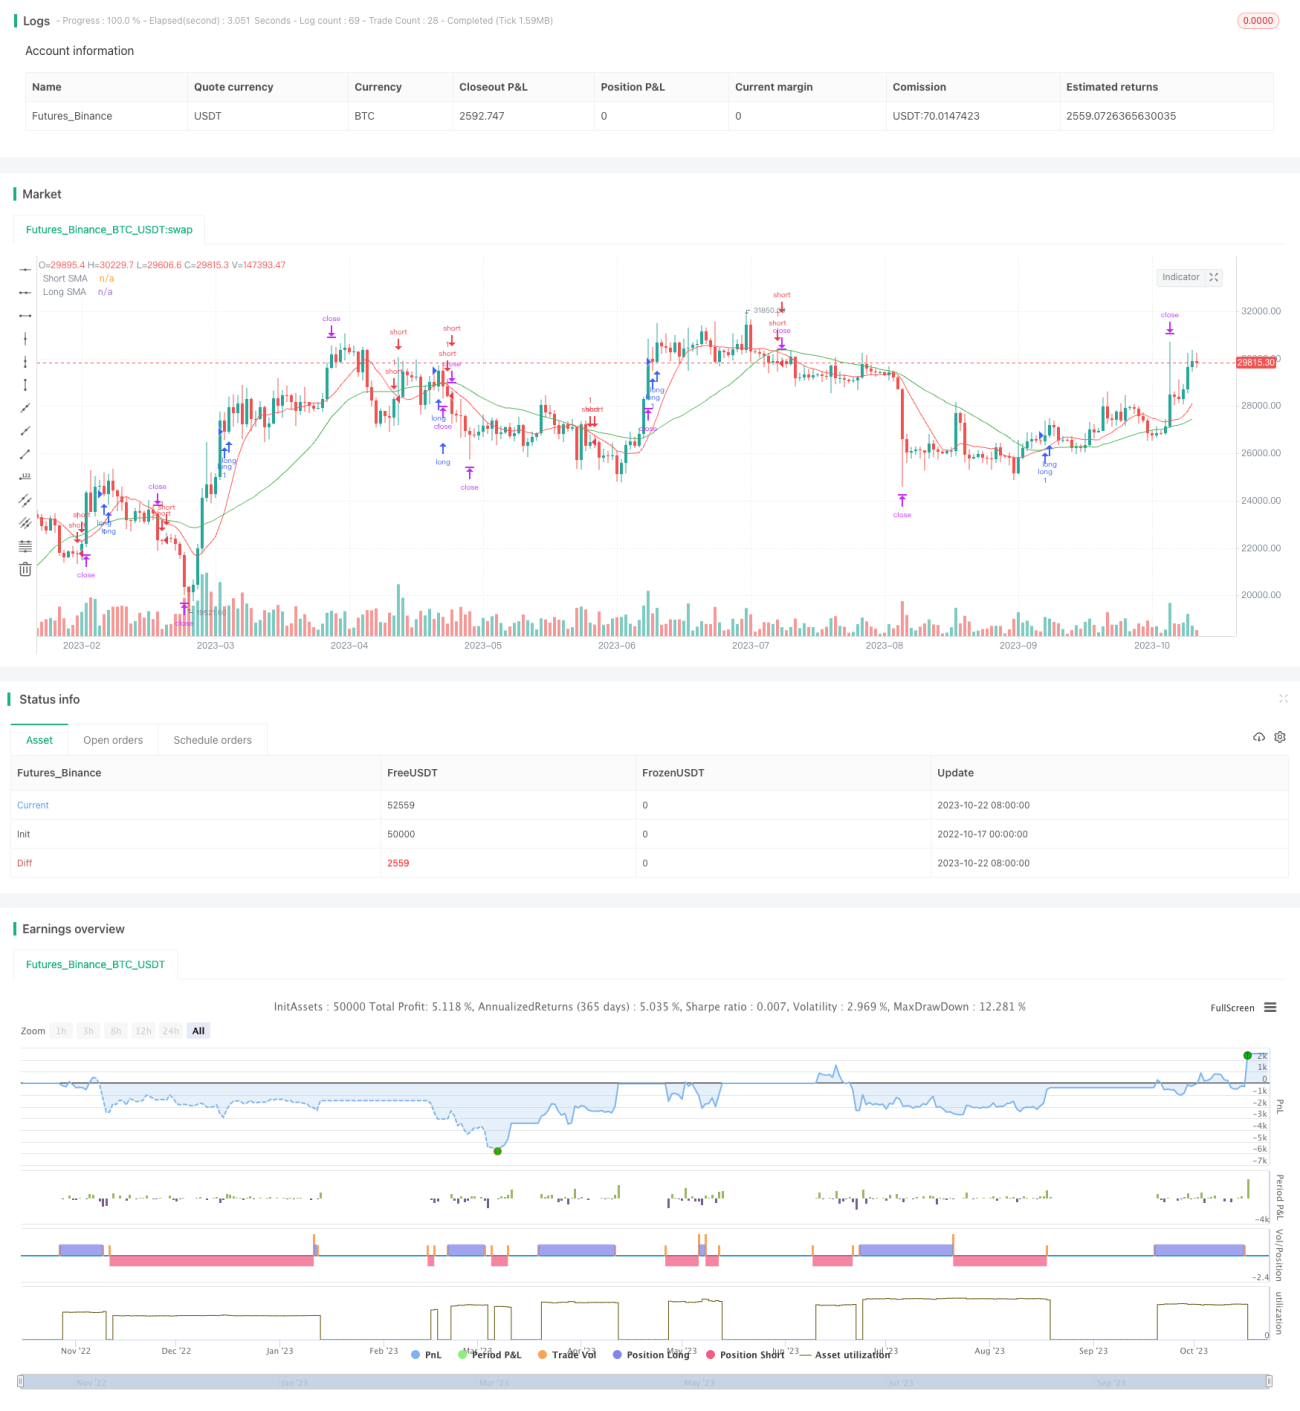
This strategy utilizes the golden cross and death cross of simple moving averages to determine entries and exits, going with the trend in a timely manner to capture turning points in market trends. It goes long when the shorter SMA crosses above the longer SMA, and goes short when the shorter SMA crosses below the longer SMA. This is a typical trend following system.
Strategy Logic
-
Calculate the 10-day simple moving average (shortSMA) and 30-day simple moving average (longSMA)
-
When shortSMA crosses above longSMA, a buy signal is generated
-
When shortSMA crosses below longSMA, a sell signal is generated
-
Require RSI to be above 50 for buy signals, and below 50 for sell signals, to avoid false breaks
-
Use ATR for stop loss and take profit trailing
The strategy mainly uses the crossover of two moving averages to determine entry timing, identifying trend inflection points. The shorter SMA reflects price changes faster, while the longer SMA provides support and resistance. When the shorter SMA crosses above the longer SMA, it indicates an uptrend start, so go long. When the shorter SMA crosses below the longer SMA, it indicates a downtrend start, so go short. RSI filters out false breaks. ATR stop loss and take profit trail price and optimize risk management.
Advantage Analysis
-
Simple to understand and learn
-
Follows market trend timely to capture turning points
-
Dual moving average crossovers are classic and effective for trend determination
-
Rational stop loss and take profit reduces loss from individual segments
-
RSI filters out false breaks effectively, reducing trading risks
-
No need to predict, just follow the trend to profit
Risk Analysis
-
Dual MAs can generate wrong signals, causing unnecessary losses
-
Delayed reaction of MAs, unable to timely catch trend reversals
-
Blindly following trends can amplify losses, position sizing needs control
-
Failure to fully filter choppy markets, prone to being trapped
-
Improper parameter settings increase trade frequency, reduce profitability
Risks can be reduced by choosing suitable parameter combinations, introducing other filters, controlling position sizing etc.
Optimization Directions
-
Optimize MA parameters to improve signal accuracy
-
Add other indicators like MACD, Bollinger Bands etc to improve strategy win rate
-
Incorporate trend-determining indicators to reduce trades in choppy markets
-
Optimize stop loss and take profit to minimize single loss and maximize single profit
-
Optimize capital management for different market conditions
-
Formulate separate strategies for trending and choppy markets
Continuous testing of different parameter sets, introducing auxiliary indicators for filtering and trend determination can steadily improve strategy performance.
Summary
This strategy employs the classic moving average crossover system to identify trend turning points for trading. It is very suitable for beginners to learn. But some weaknesses like false signals and lagging identification of reversals need to be noted. Through relentless testing and optimization of parameters, adding other indicators, the stability and profitability of the strategy can be enhanced. Most importantly, position sizing should be controlled to follow the trend trading principle, keeping losses within acceptable range and maximizing profits. Overall, the strategy logic is clear and easy to understand. It is worth researching further to improve practical trading performance.
- 1