Dual Bandpass Filter Strategy

[trans]
概述
双边波段过滤策略是基于布罗德在2010年《股票与商品》杂志上发表的文章改编的策略。该策略通过计算布罗德波段过滤器的数值,识别股票价格的波动并给出交易信号。当波段过滤器数值高于阈值时看空,当其低于阈值时看多,实现趋势跟随。
策略原理
该策略主要分为以下几步:
-
初始化参数:包括布罗德波段长度
Length、波动系数Delta、看空区阈值SellZone、看多区阈值BuyZone等。 -
计算布罗德波段过滤器
BP:通过一系列三角函数计算波段过滤器的值。 -
判断持仓方向:如果
BP高于SellZone则做空;如果低于BuyZone则做多;否则保持当前仓位。 -
输出信号:根据持仓方向输出做多做空信号。
-
绘制K线颜色:根据信号结果设置K线颜色。
-
绘制波段过滤器曲线。
该策略通过布罗德波段过滤器 captured 市场的短期波动,在波动达到一定幅度时产生交易信号,跟随市场趋势进行交易。
优势分析
-
基于布罗德波段过滤器,对市场波动更敏感,可以捕捉短期趋势。
-
通过参数优化,可以调整对波动的敏感程度,适应不同市场环境。
-
策略逻辑简单清晰,容易理解实现。
-
可以方便地进行参数调优,寻找最佳参数组合。
-
可视化的波段过滤器曲线,直观显示市场波动。
风险分析
-
布罗德波段过滤器对过度优化后可能会过于灵敏,产生错误信号。
-
无法确定波动结束点,可能导致亏损扩大。
-
交易频率可能过高,增加交易成本和滑点风险。
-
容易受到突发事件影响产生错误信号。
-
需适当调整参数以适应不同品种和市场环境。
-
可考虑设置止损来控制单笔亏损。
-
可适当延长出场时间或使用过滤条件来减少错误信号。
优化方向
-
对参数进行优化,找到最佳参数组合。优化目标可以考虑胜率、盈亏比、夏普比率等指标。
-
增加过滤条件,如突破均线、价格Pattern等,避免在非趋势区域交易。
-
考虑结合多个标的的参数组合进行basket trading,分散单边风险。
-
增加止损逻辑,控制单笔亏损。可以考虑动态止损或追踪止损。
-
增加移动止盈,锁定profit。也可以根据趋势阶段设置不同的止盈位置。
-
优化入场信号,避免在震荡市场的错误信号。可以考虑延长持仓周期或设置价格突破作为入场信号。
-
扩展为多品种套利系统,利用品种间价格差异进行对冲。
-
进行回测优化,寻找最佳的品种选择以及调仓策略。
总结
双边波段过滤策略通过计算布罗德波段过滤器判断价格波动强度,在波动达到阈值时产生交易信号,具有对市场短期趋势敏感度高、实现简单的优点。但该策略对参数和交易频率敏感,需适当优化以减少错误信号,并控制风险。总体来说,该策略为捕捉短期趋势提供了一个可选方案,但需警惕过优化问题,并适当配合其他技术指标进行交易。
||
Overview
The Dual Bandpass Filter strategy is adapted from the strategy published by Broder in Stocks & Commodities magazine in 2010. It generates trading signals by calculating the value of Broder's bandpass filter to identify price fluctuations in stocks. It goes short when the bandpass filter value is higher than the threshold, and goes long when it is lower, to follow the trend.
Strategy Logic
The key steps of this strategy are:
-
Initialize parameters including bandpass length
Length, fluctuation coefficientDelta, short zone thresholdSellZone, and long zone thresholdBuyZone. -
Calculate the Broder bandpass filter
BPusing a series of trigonometric functions. -
Determine position direction: go short if
BPis aboveSellZone; go long if belowBuyZone; otherwise, maintain current position. -
Output signals: generate long/short signals based on position direction.
-
Set bar colors based on signal results.
-
Plot the bandpass filter curve.
This strategy captures short-term fluctuations using the Broder bandpass filter, and generates trading signals when the fluctuations reach certain magnitude to follow the trend.
Advantage Analysis
-
More sensitive to market fluctuations based on the Broder bandpass filter, which can catch short-term trends.
-
The sensitivity can be adjusted through parameter tuning to adapt to different market environments.
-
Simple and clear strategy logic, easy to understand and implement.
-
Parameters can be easily optimized to find the best combination.
-
Visual bandpass filter curve intuitively shows market fluctuations.
Risk Analysis
-
Overly optimized bandpass filter may become too sensitive and generate false signals.
-
Unable to determine fluctuation end points, may lead to expanding losses.
-
High trading frequency may increase costs and slippage risks.
-
Vulnerable to black swan events that trigger false signals.
-
Parameters need adjusting for different products and markets.
-
Consider setting stop loss to control loss per trade.
-
Extend exit time or add filters to reduce false signals.
Optimization Directions
-
Optimize parameters to find the best combination, evaluating win rate, profit ratio, Sharpe ratio etc.
-
Add filters like moving average cross, price patterns to avoid trading in non-trending areas.
-
Consider combining parameters across multiple instruments for basket trading to diversify risks.
-
Add stop loss logic to control loss per trade, like dynamic stops or trailing stops.
-
Add profit taking like moving profit stops to lock in gains. Different levels can be set for different trend stages.
-
Optimize entry signals to avoid false signals in ranging markets. Consider longer holding periods or breakout signals.
-
Expand to a cross-asset arbitrage system utilizing price differentials for hedging.
-
Backtest optimization for best asset selection and rebalancing strategies.
Summary
The Dual Bandpass Filter strategy judges price fluctuations using Broder's bandpass filter and generates signals when the fluctuations reach thresholds, with the advantage of high sensitivity to short-term trends and easy implementation. However, it is sensitive to parameters and trading frequency, requiring optimization to reduce false signals and manage risks. Overall, it provides an option for catching short-term trends, but overfitting should be avoided, and other technical tools can be combined for trading.
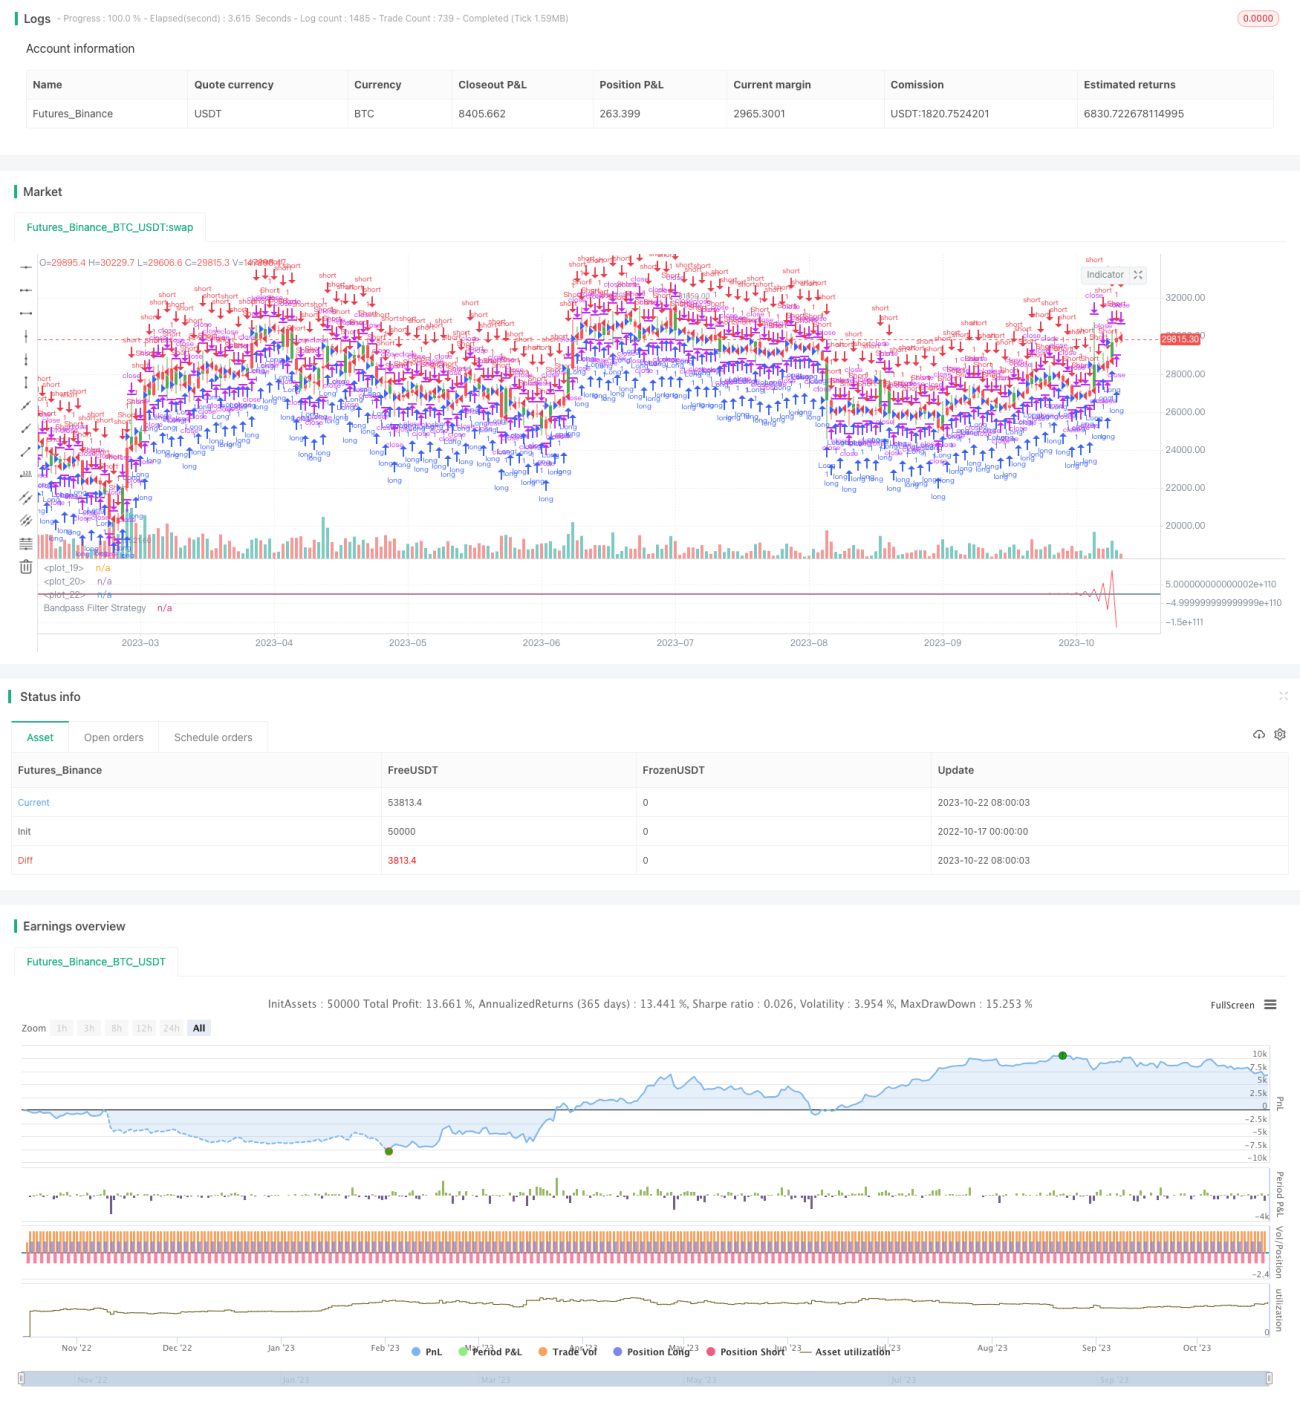
/*backtest
start: 2022-10-17 00:00:00
end: 2023-10-23 00:00:00
period: 1d
basePeriod: 1h
exchanges: [{"eid":"Futures_Binance","currency":"BTC_USDT"}]
*/

//@version=2
////////////////////////////////////////////////////////////
//  Copyright by HPotter v1.0 18/09/2018
// The related article is copyrighted material from- 1