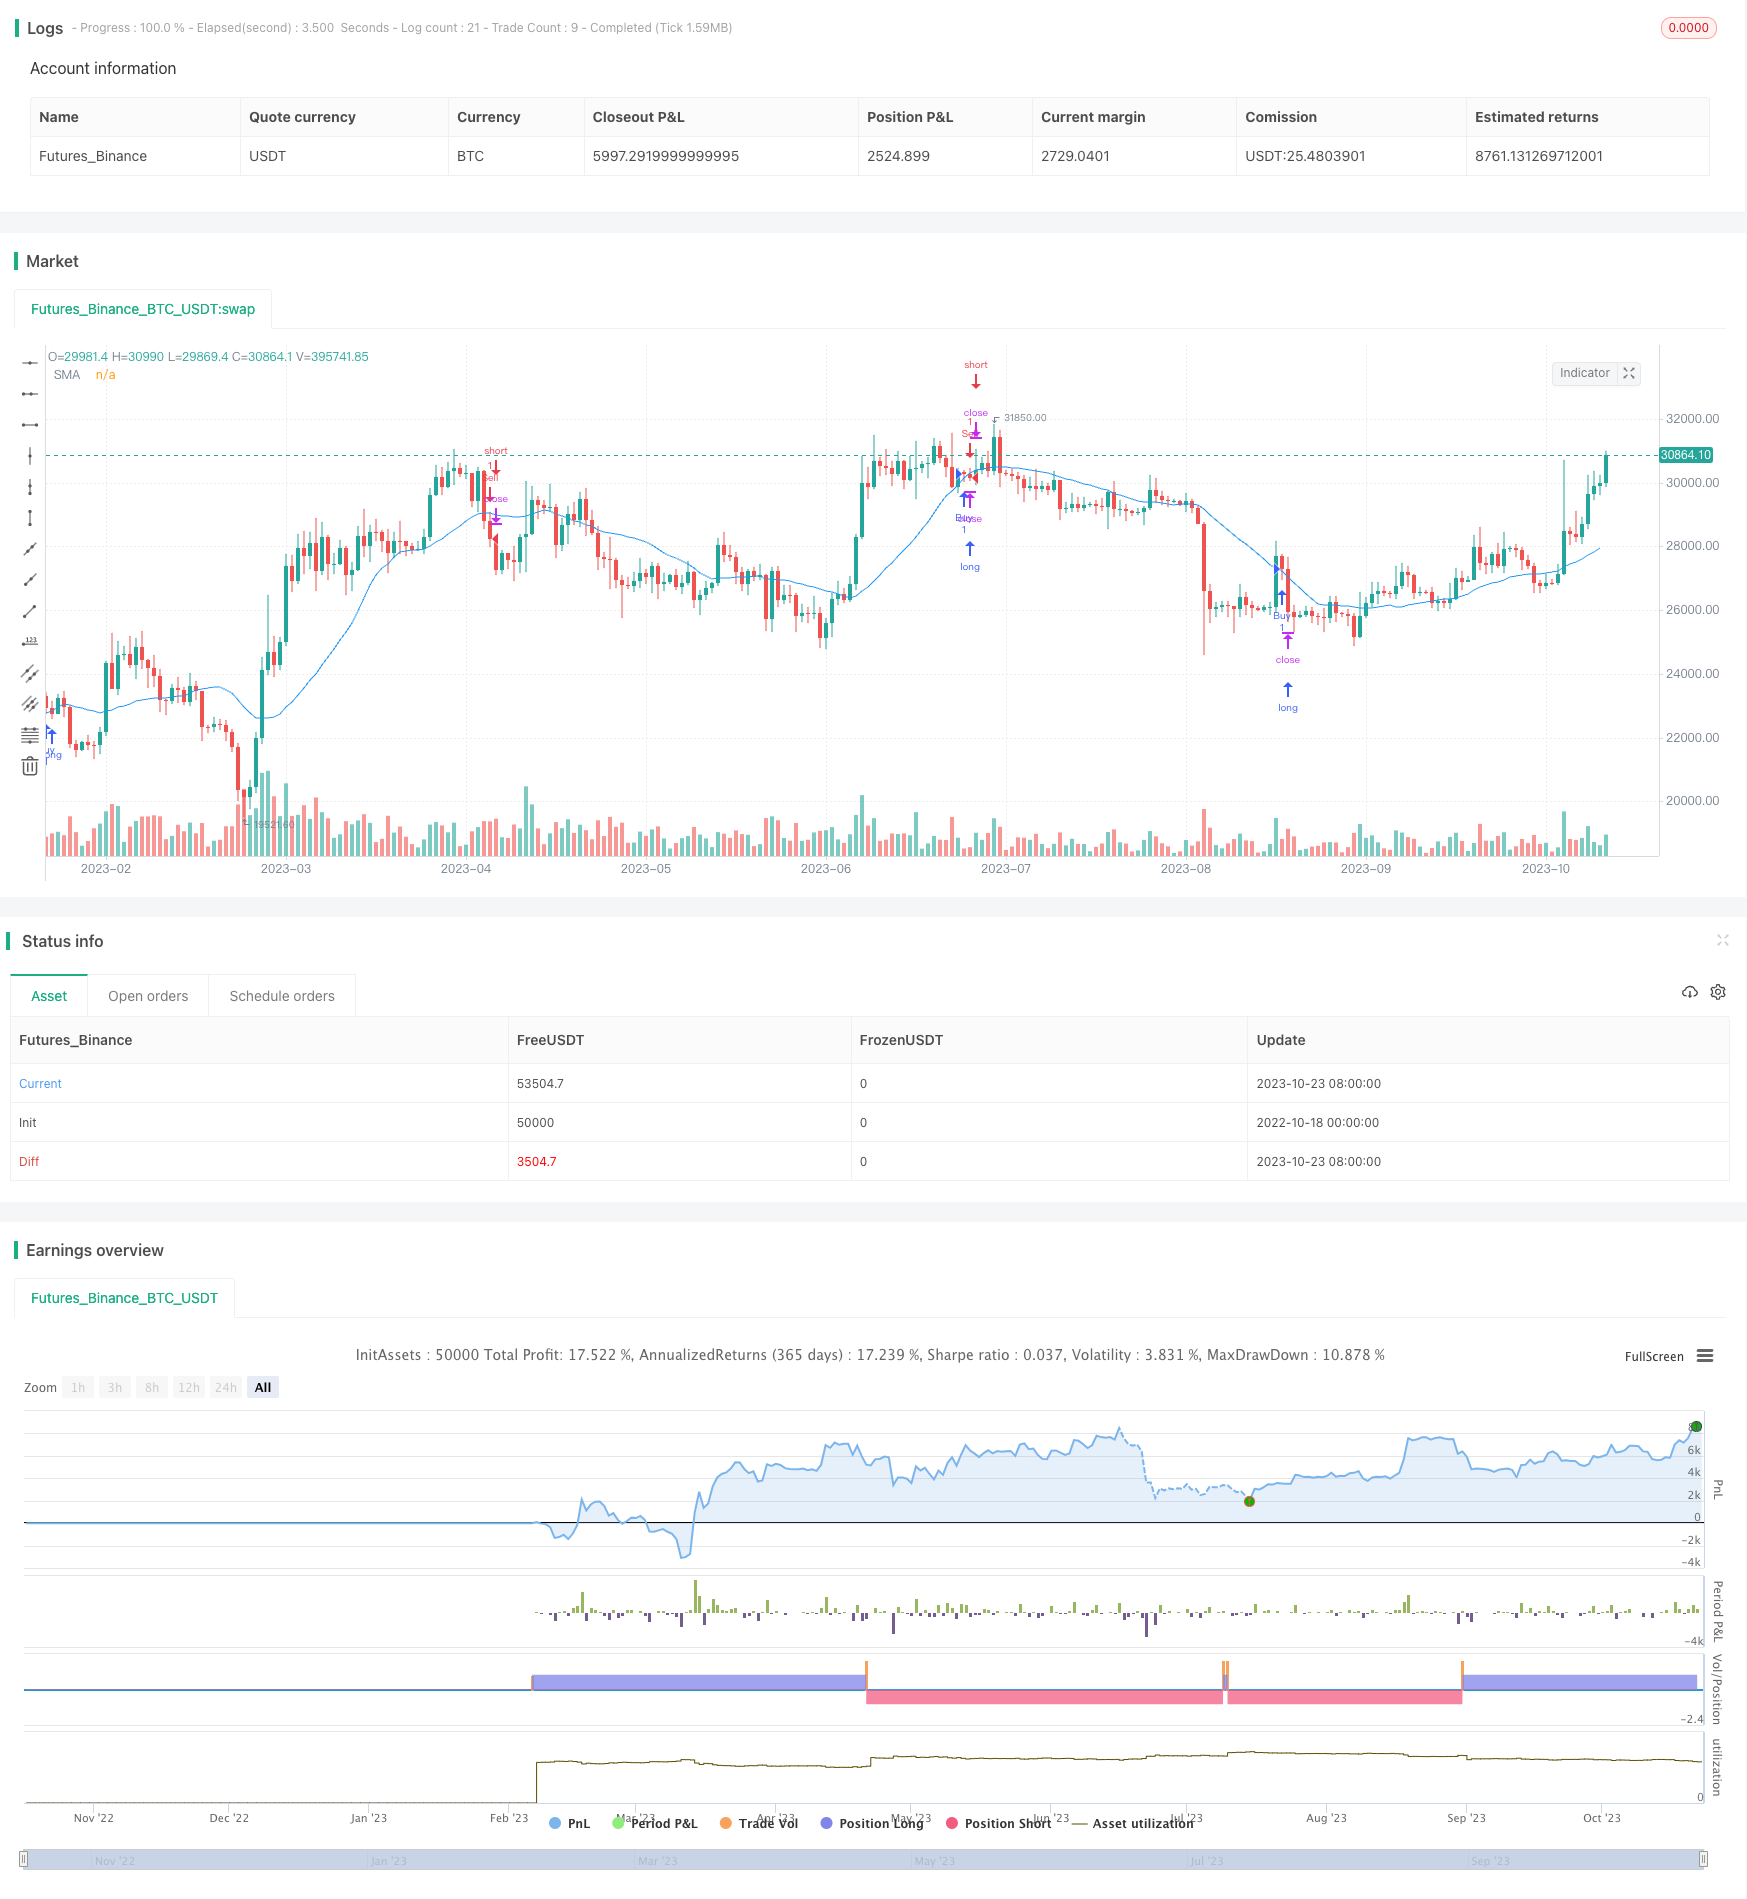
概述
光环突破策略是一种趋势跟踪策略,它结合了移动平均线和ADX指标来判断价格走势和趋势强度,在突破移动平均线时进入场内。该策略简单实用,能有效跟踪趋势,获利潜力大。
策略原理
该策略主要基于三个指标:
SMA移动平均线:计算一定周期的收盘价的简单移动平均值,判断价格趋势方向。
ADX平均趋向指数:测量趋势的强度,ADX越高表示趋势越明显。
光环条件:当收盘价高于开盘价,而收盘价接近最低价时为看涨光环,当收盘价低于开盘价,而收盘价接近最高价时为看跌光环。
策略逻辑:
计算N周期的SMA值,判断价格总体趋势。
计算M周期的ADX值,判断趋势强度。只有在ADX高于设定阈值时才产生交易信号。
当价格形成看涨光环,并且收盘价高于SMA,且ADX高于阈值时,做多。
当价格形成看跌光环,并且收盘价低于SMA,且ADX高于阈值时,做空。
止损或止盈退出仓位。
策略优势
结合趋势方向和强度指标,能有效跟踪趋势。
光环条件过滤掉大部分无效突破,提高entries的胜率。
采用SMA而非EMA,有利于把握中长线趋势。
ADX指标避免在无明显趋势时交易,有利于把握高概率操作。
策略规则简单清晰易于实现。
策略风险
SMA系滞后指标,可能出现早期入场或晚期入场导致stops被触发。可以适当优化SMA周期参数。
ADX作用是过滤震荡市,但在趋势反转时可能误判产生损失。可以降低ADX条件形成的风险。
光环虽可过滤假突破,但实际操作中仍需注意风险管理,适当调整止损位置。
策略未考虑多空平衡因素,需要人工干预或优化 logic。
策略优化方向
优化SMA和ADX的参数,找到最佳参数组合。
增加其他指标判断趋势,如布林带,KDJ等,提高entry质量。
增加平仓条件,如趋势反转,回撤比例等,完善exit logic。
增加对多空比例的判断,避免单边交易过度。
优化止损策略,改进固定止损为追踪止损或分批止损。
优化资金管理策略,更好的控制单笔风险。
总结
光环突破策略整合移动平均线和ADX指标判断趋势方向和强度,在光环条件过滤下产生交易信号,是一种简单实用的趋势跟踪策略。该策略具有把握趋势、过滤噪音的优势,但也存在趋势判断滞后、止损风险等问题。我们可以通过优化参数、完善enter和exit逻辑、改进风险管理等手段,进一步提升策略的效率和稳定性。
/*backtest
start: 2022-10-18 00:00:00
end: 2023-10-24 00:00:00
period: 1d
basePeriod: 1h
exchanges: [{"eid":"Futures_Binance","currency":"BTC_USDT"}]
*/

//@version=2
strategy("Glory Hole with SMA + ADX", overlay=true)
len = input(20, minval=1, title="SMA")
src = input(close, title="Source")
ADXlevel = input(30, minval=1, title="ADX Tradelevel")
out = sma(src, len)

//adx
adxlen = input(14, title="ADX Smoothing")
dilen = input(14, title="DI Length")
dirmov(len) =>
	up = change(high)
	down = -change(low)
	truerange = rma(tr, len)
	plus = fixnan(100 * rma(up > down and up > 0 ? up : 0, len) / truerange)
	minus = fixnan(100 * rma(down > up and down > 0 ? down : 0, len) / truerange)
	[plus, minus]

adx(dilen, adxlen) =>
	[plus, minus] = dirmov(dilen)
	sum = plus + minus
	adx = 100 * rma(abs(plus - minus) / (sum == 0 ? 1 : sum), adxlen)

sig = adx(dilen, adxlen)

plot(out, title="SMA", color=blue)

bullish = ((out<close) and (out<open) and (out>low) and (sig>ADXlevel))
bearish = ((out>close) and (out>open) and (out<high) and (sig>ADXlevel))


if (bullish)
    strategy.entry("Buy", strategy.long)

if (bearish)
    strategy.entry("Sell", strategy.short)