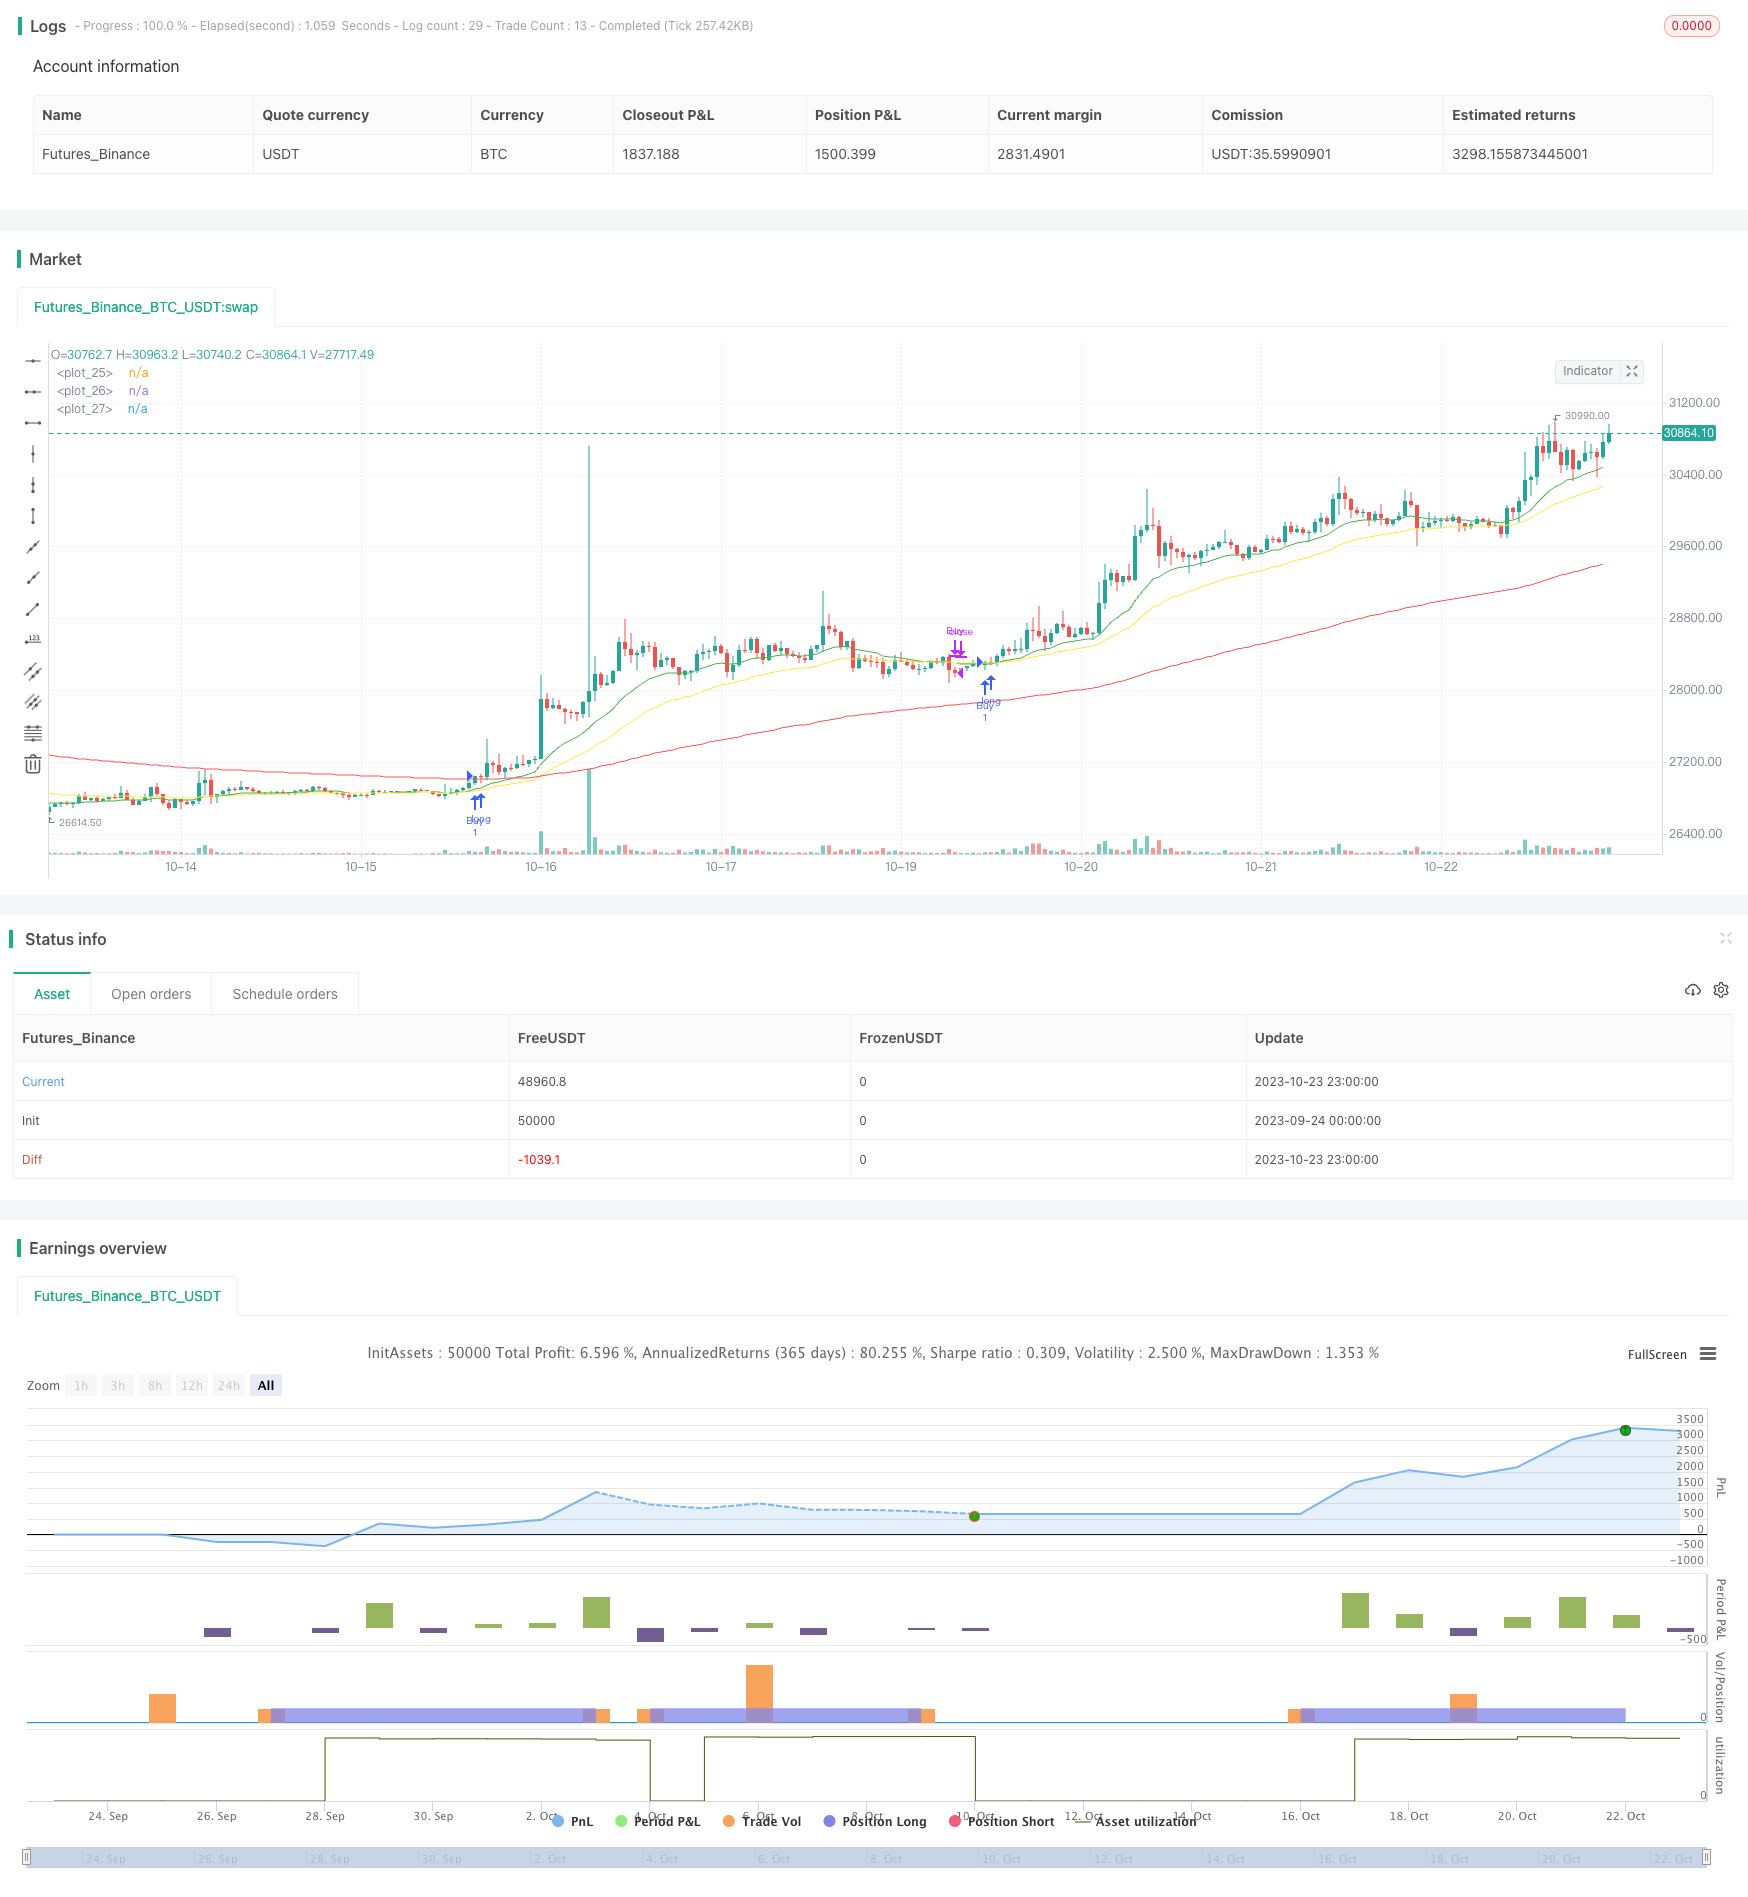
概述
该策略运用均线交叉的原理,结合RSI指标,判断趋势方向,进行买入和卖出操作。
策略原理
该策略使用3条不同周期的EMA均线,分别是快线、中线和慢线。当快线上穿中线时判断为买入信号;当快线下穿中线时判断为卖出信号。
同时,该策略还同时使用RSI指标来判断超买超卖情况。RSI通过一个周期内的平均涨幅和平均跌幅的比值,来显示一个资产的相对强弱。当RSI超过设置的超买线时,认为处于超买状态;当RSI低于设置的超卖线时,认为处于超卖状态。
该策略的买入条件是:
- 价格上穿快线、中线、慢线
- RSI上穿设置的超卖线
卖出条件是:
- 快线下穿中线
- RSI下穿设置的中线
通过均线判断大趋势方向,结合RSI来发现短期超买超卖机会,这个策略综合运用了趋势交易和反转交易的策略。
优势分析
该策略结合均线交叉和RSI指标,同时判断趋势和超买超卖,可以过滤一些假突破带来的噪音交易。使用三条均线,可以比较清晰地判断趋势状态。
RSI指标的设置也使得该策略可以在超买超卖区域抓取较优的入场和出场时机。
该策略还考虑了交易成本,通过只在价格突破三条均线的时候才入场,可以避免被套。
风险分析
该策略依然会存在回测过拟合的风险。实盘中市场环境的变化,会导致参数不再适应新的市场状况。
在震荡行情中,该策略容易产生虚假信号,从而可能造成亏损。
RSI参数的设定需要根据不同市场调整,如果参数设置不当,也容易造成错过机会或者产生虚假信号。
优化方向
可以考虑在更长时间周期的图表上再次验证信号,避免被短期市场噪音干扰。
可以试验在进入市场前,等待突破或回踩均线再入场,进一步验证信号。
可以结合其他指标,如MACD、布林带等,组合多个指标的信号,提高 Entry 命中率。
可以使用机器学习算法辅助优化参数,使策略更具适应性。
可以考虑加入止损策略,在趋势不确定时及时止损。
总结
该策略整合均线交叉和RSI指标,在判断趋势的同时,发现短期趋势反转机会。它有效利用了趋势交易和反转交易的优点,可以在长期看好的方向持有同时,捕捉短线机会。该策略有一定的优化空间,通过进一步验证信号、优化参数、加入止损等手段,可以使策略更稳定可靠。但需要注意回测过拟合的问题,实盘环境将考验策略的弹性。综合来说,该策略作为学习型策略具有一定参考价值,但实盘效果还需进一步验证。
/*backtest
start: 2023-09-24 00:00:00
end: 2023-10-24 00:00:00
period: 1h
basePeriod: 15m
exchanges: [{"eid":"Futures_Binance","currency":"BTC_USDT"}]
*/

// This source code is subject to the terms of the Mozilla Public License 2.0 at https://mozilla.org/MPL/2.0/
// © chadsadachai

//@version=5
strategy("EMA Cross V1", overlay= true)

//rsi
length = input.int(title = "Rsi Lenght" , defval=26 , minval=1, maxval=50)
overS = input.int(title = "Rsi OVS line" , defval=30 , minval=1, maxval=40)
overB = input.int(title = "Rsi OVB line" , defval=70 , minval=1, maxval=100)
mLine = input.int(title = "Rsi Medium line" , defval=42 , minval=1, maxval=60)
price = close
vrsi = ta.rsi(price, length)
co = vrsi >= mLine and vrsi < overB
cu = ta.crossunder(vrsi, overB)
//ema
F = input.int(title = "EMA Fast" , defval=17 , minval=1, maxval=50)
M = input.int(title = "EMA Medium" , defval=35, minval=1, maxval=100)
S = input.int(title = "EMA Slow" , defval=142, minval=1, maxval=200)
emaF = ta.ema(price , F)
emaM = ta.ema(price , M)
emaS = ta.ema(price , S)

//plot
plot(emaF , color = color.green , linewidth=1)
plot(emaM , color = color.yellow , linewidth=1)
plot(emaS , color = color.red , linewidth=1)

//Time Stamp
start = timestamp(input.int(title = "Start Year" , defval=2011 , minval=2011, maxval=2025), input.int(title = "Start Month" , defval=1 , minval=1, maxval=12), input.int(title = "Start Day" , defval=1 , minval=1, maxval=31), 0, 0)
end = timestamp(input.int(title = "End Year" , defval=2025 , minval=2011, maxval=2025), input.int(title = "End Month" , defval=1 , minval=1, maxval=12), input.int(title = "End Day" , defval=1 , minval=1, maxval=31), 0, 0)
// years = input.int(title = "Year" , defval=2018 , minval=2011, maxval=2025)
// months = input.int(title = "Month" , defval=1 , minval=1, maxval=12)
// days = input.int(title = "Day" , defval=1 , minval=1, maxval=31)

//longCondition Default
// longCondition1 = EMA_Fast >= EMA_Slow and EMA_Fast >= EMA_Medium//ta.crossover(EMA_Fast, EMA_Slow)  EMA_Fast > EMA_Slow and EMA_Medium > EMA_Slow
// longCondition3 = price >= EMA_Medium and price > EMA_Slow
// longCondition2 = vrsi >= overSold and vrsi <= overBought

//longCondition & shortCondition ETHUSD
// 1.price > emaF > emaM > emaS
// 2.rsi overcross overS
longC1 = price > emaF and price > emaM and price > emaS
// longC1 = ta.crossover(emaF, emaM)
longC2 = if longC1
    co
// shortC1 = EMA_Fast < EMA_Medium //and EMA_Fast < EMA_Slow and EMA_Medium < EMA_Slow //and cu
// shortC2 = overBought > vrsi //and vrsi < overBought //overSold < vrsi and vrsi < mediumLine

// exitLong Condition
// 1.price < emaF < emaM < emaS
// 2.rsi overcross mediumLine
exitLong1 = ta.crossunder(emaF, emaM) //or emaF < emaM//and price < emaM and price < emaF
exitLong2 = ta.crossunder(vrsi,mLine)
//exitLong3 = price < emaM
//strategy.entry
if time >=start and time <=end
    strategy.entry("Buy", strategy.long , when = longC1 and longC2)

// if(exitLong1 or exitLong2)
strategy.close("Buy" , when = exitLong1 or exitLong2)

// exitShort1 = EMA_Fast > EMA_Medium
// //exitShort2 = ta.crossover(vrsi , mediumLine)
// exitShort2 = ta.crossunder (vrsi,mediumLine)
// strategy.close("Short" , when = exitShort1 or exitShort2)
// //shortCondition = cu


// //if (shortCondition1 and shortCondition2)
//     //strategy.entry("My Short Entry Id", strategy.short)