Multi Timeframe MACD Heatmap Strategy

Overview
The core idea of this strategy is to use the combination signals of MACD indicators from multiple different timeframes to determine the timing of trend changes and implement low-risk trend following trading.
Strategy Logic
-
The strategy uses 5 MACD indicators from different timeframes, including 60min, 120min, 240min, 480min and Daily, forming a multi-timeframe combination of MACD indicators.
-
When all 5 MACDs are positive (or negative) and the previous bar was not all positive (or negative) MACDs, it is determined as a long (or short) signal and goes long (or short).
-
The stop loss method is fixed pips stop loss.
-
The take profit method is two-tier trailing stop, closing a portion and all of the positions separately.
-
When the MACD indicators show one long one short situation, it is judged as a signal reversal and close the current position.
-
TsL is also used for trailing stop loss.
-
The stop loss to breakeven feature is used. When reaching certain profit target, the stop loss will move to break even, locking in profits.
-
Pineconector syntax is used to dynamically generate trading signal alerts.
Advantages
-
Multi-timeframe MACD combination can improve signal accuracy, capturing big trends and filter out some noise.
-
The two-tier trailing take profit allows taking partial profits multiple times during big trends.
-
Fixed pips stop loss can control single trade loss amount.
-
Closing when MACDs inconsistent can realize stop loss timely and avoid stop loss break.
-
TsL trailing stop follows the price change in real time.
-
SL to BE locks in some profit after turning losing positions to winning positions.
-
Dynamic trading alerts can connect to MT4/5 for auto trading.
Risks and Solutions
-
MACD signals may have false breakouts, causing unnecessary losses. Fine tune MACD parameters to filter out excessive false signals.
-
Fixed pips stop loss may be too big or too small. Test different levels to find optimal parameter.
-
Two take profit levels may be too close or too far. Test different levels to find optimal parameter.
-
BE trigger may be too early or too late. Test different BE trigger points to find optimal parameter.
-
Trailing stop distance may be too big or too small. Test different distances to find optimal parameter.
Optimization Directions
-
Test more timeframes of MACD combination to find the best combo to capture market trends.
-
Introduce more indicators to determine market condition, avoiding opening positions during unfavorable conditions.
-
Research parameter differences between products, designing adaptive stop loss and take profit system.
-
Incorporate machine learning techniques for dynamic optimization of parameters.
-
Introduce position sizing for dynamic adjustment of position size and risk control.
Conclusion
In summary, this strategy uses multi-timeframe MACD to determine trends, with dual trailing take profit, trailing stop loss and BE features to lock in profits, fixed stop loss to control risk. It is a relatively stable trend following strategy. Further enhancements in stability and profitability can be achieved through parameter optimization and functionality expansion. The key is finding the optimal parameter combination to achieve the best risk-reward balance.
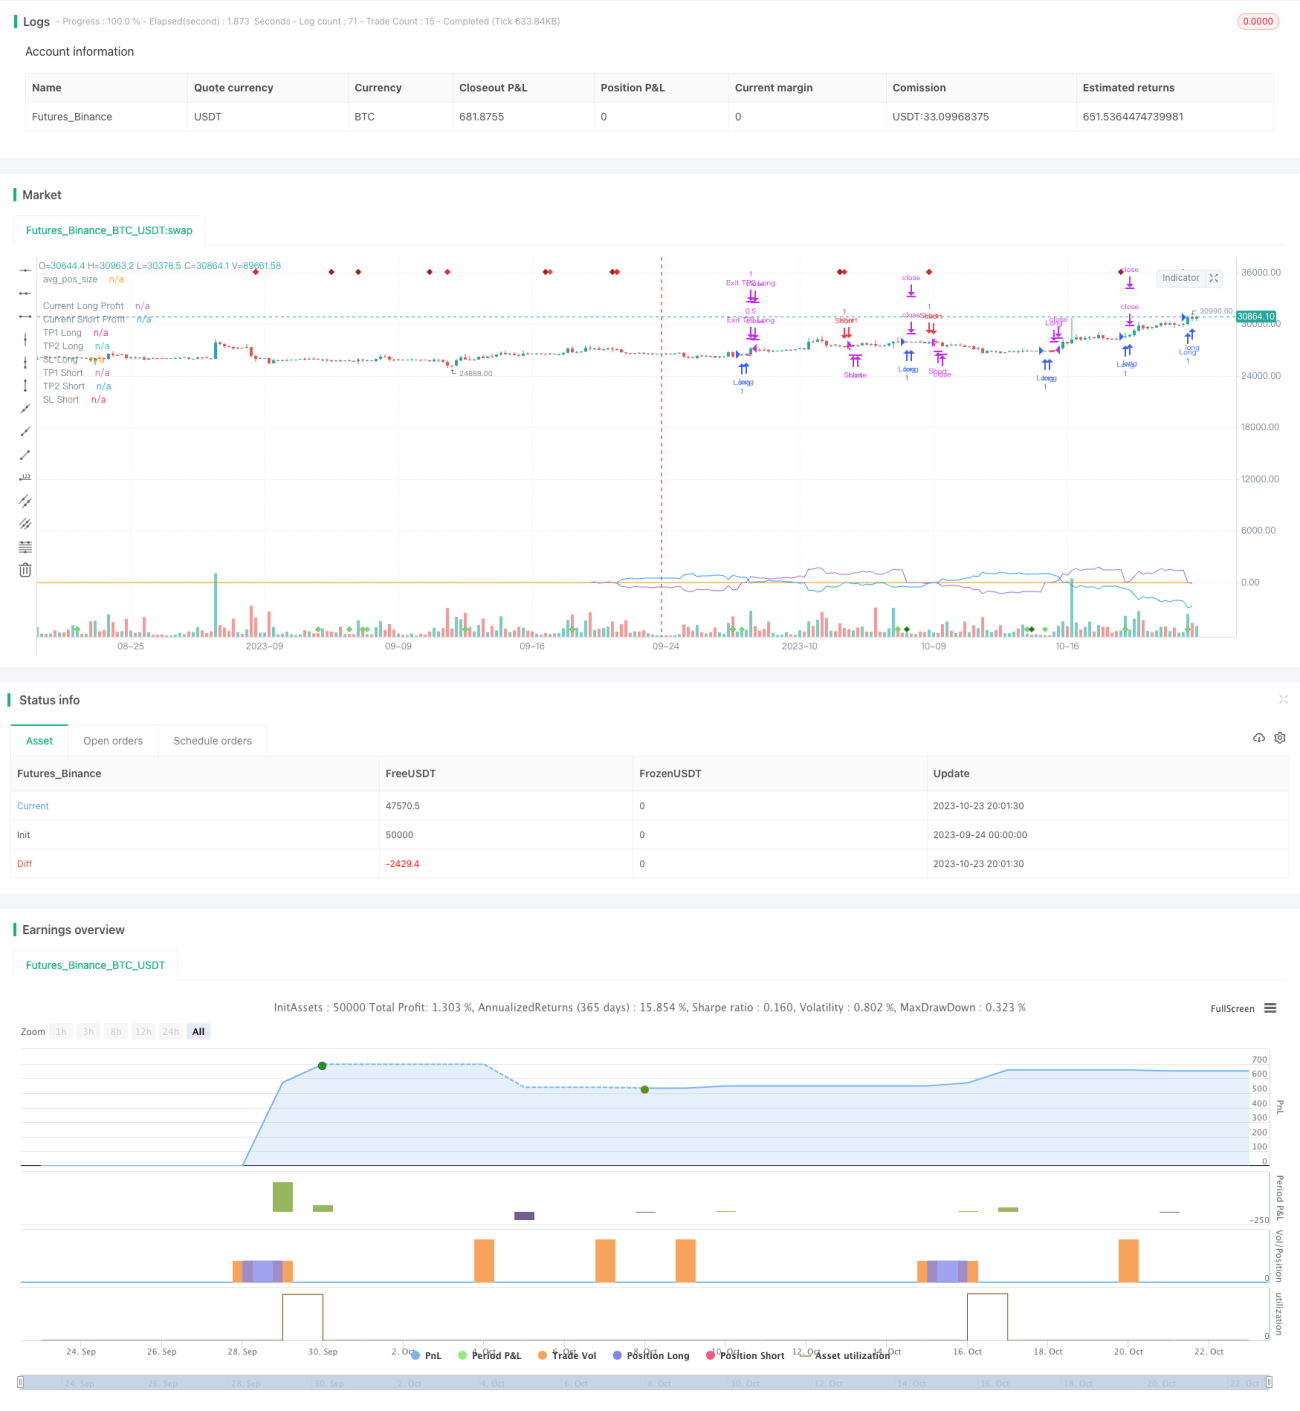
/*backtest
start: 2023-09-24 00:00:00
end: 2023-10-24 00:00:00
period: 6h
basePeriod: 15m
exchanges: [{"eid":"Futures_Binance","currency":"BTC_USDT"}]
*/

// This source code is subject to the terms of the Mozilla Public License 2.0 at https://mozilla.org/MPL/2.0/

//@version=5
//@strategy_alert_message {{strategy.order.alert_message}}- 1