Multi-indicator Decision Based Short Term Trend Strategy

Author: ChaoZhang, Date: 2023-10-25 15:31:30
Tags:

img

Overview

This strategy incorporates three technical indicators across different dimensions, including support/resistance levels, moving average system, and oscillator indicators, to determine short-term trend direction for higher win rate.

Strategy Logic

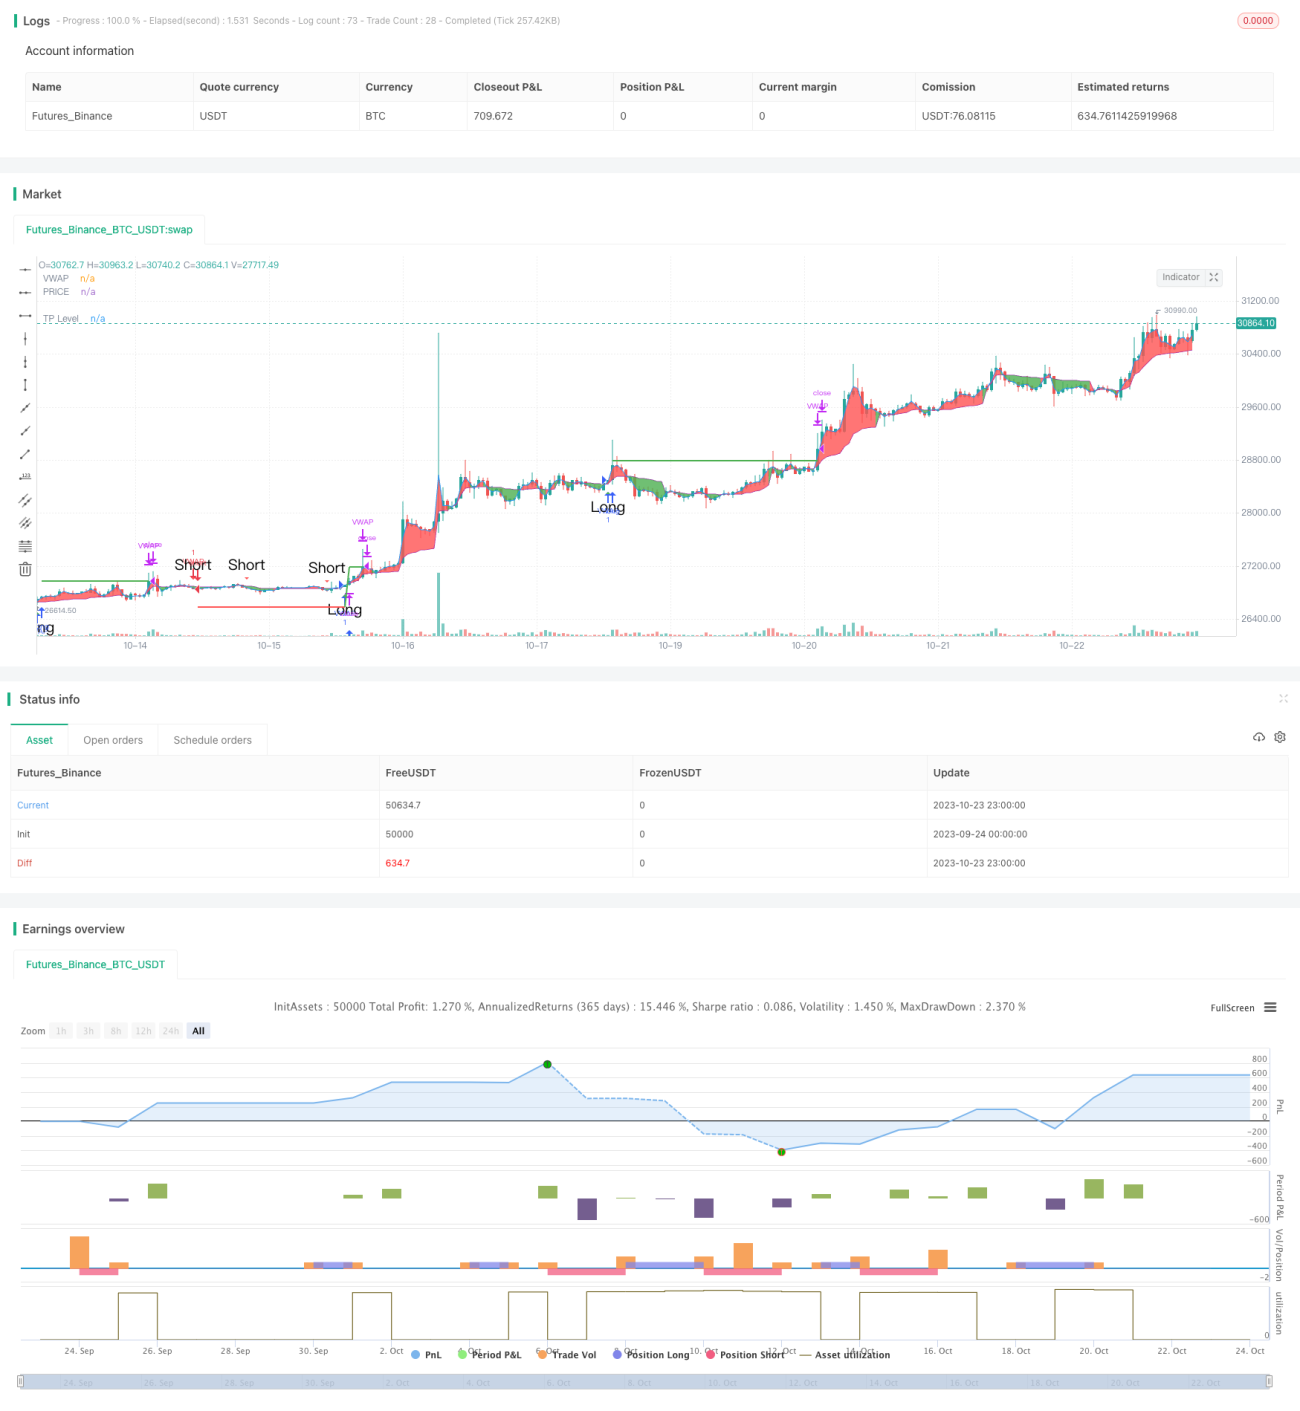
The code first calculates the support/resistance levels of the price, including the standard pivot points and Fibonacci retracement levels, and plots them on the chart. Breaking these key levels signals important trend signals.

Then it calculates the Volume Weighted Average Price (VWAP) and Average Price for golden cross and death cross signals. This belongs to medium-long term trend judgment.

Finally it calculates the Stochastic RSI oscillator for overbought and oversold signals. This belongs to the overbought/oversold indicator.

By combining signals across these three dimensions, if the support/resistance, VWAP, and Stochastic RSI all give buy signals, it will open long position. If all give sell signals, it will open short position.

Advantage Analysis

The biggest advantage of this strategy is the combination of indicators across different dimensions, making the judgment more comprehensive and accurate with higher win rate. First the support/resistance levels define the major trend. Then VWAP determines the medium-long term trend. Finally the Stochastic RSI judges the overbought/oversold condition. With all three indicators firing at the same time, it can effectively filter out false signals and improve entry accuracy.

In addition, the take profit function helps lock in certain percentage of profits, aiding risk management.

Risk Analysis

The main risk of this strategy is its reliance on simultaneous signals from all indicators for decision making. If some indicators give out faulty signals, it may lead to wrong decisions. For example, when Stochastic RSI shows overbought but VWAP and support/resistance still indicate bullish, it may miss the buying opportunity by not entering.

Also, improper parameter tuning of the indicators could lead to wrong signal judgments that requires iterative backtesting for optimization.

Additionally, black swan events in the short-term market may invalidate signals from the indicators. To guard against this risk, stop loss strategies could be implemented to limit downside on individual trades.

Improvement Opportunities

The strategy can be further improved in the following aspects:

  1. Incorporate more indicator signals like volume to gauge trend strength for better accuracy.

  2. Add machine learning models to train on the multidimensional indicators and automatically discover optimal strategies.

  3. Optimize parameters based on different products for adaptive tuning.

  4. Introduce stop loss and position sizing based on drawdown to better control risks.

  5. Perform portfolio optimization to find low-correlation products for diversity.

Conclusion

Overall this strategy is well suited for short-term trend trading. By combining signals across dimensions, it can filter out significant noise for higher win rate. But risks of erroneous signals remain that can be improved on through further enhancements. With continued optimization, this strategy has the potential to become an efficient and robust short-term system.


/*backtest
start: 2023-09-24 00:00:00
end: 2023-10-24 00:00:00
period: 1h
basePeriod: 15m
exchanges: [{"eid":"Futures_Binance","currency":"BTC_USDT"}]
*/

// EmperorBTC's VWAP Indicator & Strategy
//              v2.1
// 
//      coded by Bogdan Vaida

// This indicator was created after EmperorBTC's conditions on Twitter. 
// Good timeframes for it: 30', 15', 5'
// To convert from strategy to study switch the commented lines in the beginning
// and at the end of the script and vice versa.

// What this indicator does is to check if:
// o Pivot Point was crossed
// o Stoch-RSI and VWAP were crossed in current or previous candle
// o Candle (or previous candle) close is in the trend direction
// If all these are true then it will go long or short based on direction.


// FUTURE IDEAS: 
//  - Volume Expansion
//  - Candle Stick patterns

//@version=4

// 🔥Uncomment the line below for the indicator and comment the strategy lines
// study(title="EmperorBTC's VWAP Indicator", shorttitle="EMP-VWAP", overlay=true)

// 🔥 Uncomment the line below for the strategy and comment the above line
strategy(title="EmperorBTC's VWAP Strategy", shorttitle="EMP-VWAP", overlay=true, pyramiding=1)

plotAveragePriceCrossedPivotPoint = input(false, title="Plot Close Price Crossing Pivot Points?", group="Pivot Points")
plotPivotPoints = input(false, title="Plot Pivot Points?", group="Pivot Points")
pivotPointsType = input(title="Pivot Points type", defval="Fibonacci", options=["Fibonacci", "Traditional"], group="Pivot Points")

pivotPointCircleWidth = input(2, title="Width of Pivot Point circles", minval=1, group="Pivot Points")

plotVWAP = input(true, title="Plot VWAP?", group="VWAP")
plotAvgPrice = input(true, title="Plot Average Price?", group="VWAP")
plotVWAPCrossPrice = input(false, title="Plot Price Crossing VWAP?", group="VWAP")
reso = input(title="Period", type=input.resolution, defval="D", group="VWAP")
cumulativePeriod = input(14, "VWAP Cumulative Period", group="VWAP")

plotStochRSICross = input(false, title="Plot StochRSI Cross?", group="StochRSI")
smoothK = input(3, "K", minval=1, group="StochRSI", inline="K&D")
smoothD = input(3, "D", minval=1, group="StochRSI", inline="K&D")
lengthRSI = input(14, "RSI Length", minval=1, group="Stochastic-RSI", inline="length")
lengthStoch = input(14, "Stochastic Length", minval=1, group="Stochastic-RSI", inline="length")
rsiSrc = input(close, title="RSI Source", group="Stochastic-RSI")

plotLong = input(true, title="Plot Long Opportunity?", group="Strategy only")
plotShort = input(true, title="Plot Short Opportunity?", group="Strategy only")
tradingDirection = input(title="Strategy trading Direction: ", defval="L&S", options=["L&S", "L", "S"], group="Strategy only")
takeProfit = input(1.0, title='Take Profit %', group="Strategy only") / 100
plotTP = input(true, title="Plot Take Profit?", group="Strategy only")
startDate = input(title="Start Date", type=input.integer,
     defval=1, minval=1, maxval=31, group="Backtesting range", inline="Start Date")
startMonth = input(title="Start Month", type=input.integer,
     defval=1, minval=1, maxval=12, group="Backtesting range", inline="Start Date")
startYear = input(title="Start Year", type=input.integer,
     defval=2017, minval=1800, maxval=2100, group="Backtesting range", inline="Start Date")
endDate = input(title="End Date", type=input.integer,
     defval=31, minval=1, maxval=31, group="Backtesting range", inline="End Date")
endMonth = input(title="End Month", type=input.integer,
     defval=12, minval=1, maxval=12, group="Backtesting range", inline="End Date")
endYear = input(title="End Year", type=input.integer,
     defval=2050, minval=1800, maxval=2100, group="Backtesting range", inline="End Date")


// PivotPoint code (PVTvX by DGT has some nice code on PP)
candleHigh  = security(syminfo.tickerid,"D", high[1], lookahead=barmerge.lookahead_on)
candleLow   = security(syminfo.tickerid,"D", low[1], lookahead=barmerge.lookahead_on)
candleClose = security(syminfo.tickerid,"D", close[1], lookahead=barmerge.lookahead_on)

pivotPoint = (candleHigh+candleLow+candleClose) / 3

float resistance1 = na
float resistance2 = na
float resistance3 = na
float support1 = na
float support2 = na
float support3 = na

if pivotPointsType == "Fibonacci"
    resistance1 := pivotPoint + 0.382 * (candleHigh - candleLow)
    resistance2 := pivotPoint + 0.618 * (candleHigh - candleLow)
    resistance3 := pivotPoint + (candleHigh - candleLow)
    support1 := pivotPoint - 0.382 * (candleHigh - candleLow)
    support2 := pivotPoint - 0.618 * (candleHigh - candleLow)
    support3 := pivotPoint - (candleHigh - candleLow)
else if pivotPointsType == "Traditional"
    resistance1 := 2 * pivotPoint - candleLow
    resistance2 := pivotPoint + (candleHigh - candleLow)
    resistance3 := candleHigh + 2 * (pivotPoint - candleLow) 
    support1 := 2 * pivotPoint - candleHigh
    support2 := pivotPoint - (candleHigh - candleLow)
    support3 := candleLow - 2 * (candleHigh - pivotPoint)

plot(series = plotPivotPoints ? support1 : na, color=#ff0000, title="S1", style = plot.style_circles, linewidth = pivotPointCircleWidth)
plot(series = plotPivotPoints ? support2 : na, color=#800000, title="S2", style = plot.style_circles, linewidth = pivotPointCircleWidth)
plot(series = plotPivotPoints ? support3 : na, color=#330000, title="S3", style = plot.style_circles, linewidth = pivotPointCircleWidth)
plot(series = plotPivotPoints ? pivotPoint : na, color=#FFA500, title="PP", style = plot.style_circles, linewidth = pivotPointCircleWidth)
plot(series = plotPivotPoints ? resistance1 : na, color=#00FF00, title="R1", style = plot.style_circles, linewidth = pivotPointCircleWidth)
plot(series = plotPivotPoints ? resistance2 : na, color=#008000, title="R2", style = plot.style_circles, linewidth = pivotPointCircleWidth)
plot(series = plotPivotPoints ? resistance3 : na, color=#003300, title="R3", style = plot.style_circles, linewidth = pivotPointCircleWidth)

pivotPointCrossedUp = ((low < support3) and (close > support3)) or ((low < support2) and (close > support2)) or ((low < support1) and (close > support1)) or  ((low < pivotPoint) and (close > pivotPoint))
pivotPointCrossedDown = ((high > support3) and (close < support3)) or ((high > support2) and (close < support2)) or ((high > support1) and (close < support1)) or  ((high > pivotPoint) and (close < pivotPoint))
plotPPColor = pivotPointCrossedUp ? color.green :
     pivotPointCrossedDown ? color.red :
     na

plotshape(series = plotAveragePriceCrossedPivotPoint ? (pivotPointCrossedUp or pivotPointCrossedDown) : na, title="PP Cross", style = shape.triangleup, location=location.belowbar, color=plotPPColor, text="PP", size=size.small)

// VWAP (taken from the TV code)
// There are five steps in calculating VWAP:
//
// 1. Calculate the Typical Price for the period. [(High + Low + Close)/3)]
// 2. Multiply the Typical Price by the period Volume (Typical Price x Volume)
// 3. Create a Cumulative Total of Typical Price. Cumulative(Typical Price x Volume)
// 4. Create a Cumulative Total of Volume. Cumulative(Volume)
// 5. Divide the Cumulative Totals. 
//
// VWAP = Cumulative(Typical Price x Volume) / Cumulative(Volume)

// Emperor's Edition
t = time(reso)
debut = na(t[1]) or t > t[1]

addsource = ohlc4 * volume
addvol = volume
addsource := debut ? addsource : addsource + addsource[1]
addvol := debut ? addvol : addvol + addvol[1]
vwapValue = addsource / addvol

pVWAP = plot(series = plotVWAP ? vwapValue : na, color=color.purple, title="VWAP")
pAvgPrice = plot(series = plotAvgPrice ? ohlc4 : na, color=color.blue, title="PRICE")
fill(pVWAP, pAvgPrice, color = ohlc4 > vwapValue ? color.red : color.green, title="VWAP PRICE FILL")

vwapCrossUp = (low < vwapValue) and (vwapValue < high) and (close > open) // added green candle check
vwapCrossDown = (high > vwapValue) and (vwapValue > low) and (close < open) // added red candle check

plotVWAPColor = vwapCrossUp ? color.green :
     vwapCrossDown ? color.red :
     na
plotshape(series = plotVWAPCrossPrice ? (vwapCrossUp or vwapCrossDown) : na, title="VWAP Cross Price", style=shape.triangleup, location=location.belowbar, color=plotVWAPColor, text="VWAP", size=size.small)


// Stochastic RSI

rsi1 = rsi(rsiSrc, lengthRSI)
k = sma(stoch(rsi1, rsi1, rsi1, lengthStoch), smoothK)
d = sma(k, smoothD)

sRsiCrossUp = k[1] < d[1] and k > d
sRsiCrossDown = k[1] > d[1] and k < d

plotColor = sRsiCrossUp ? color.green :
     sRsiCrossDown ? color.red :
     na
plotshape(series = plotStochRSICross ? (sRsiCrossUp or sRsiCrossDown) : na, title="StochRSI Cross Up", style=shape.triangleup, location=location.belowbar, color=plotColor, text="StochRSI", size=size.small)

// Long Trades
sRsiCrossedUp = sRsiCrossUp or sRsiCrossUp[1]
vwapCrossedUp = vwapCrossUp or vwapCrossUp[1]
// longCond1 = (sRsiCross and vwapCross) or (sRsiCross[1] and vwapCross) or (sRsiCross and vwapCross[1])
longCond1 = (sRsiCrossedUp[1] and vwapCrossedUp[1])
longCond2 = pivotPointCrossedUp[1]
longCond3 = (close[1] > open[1]) and (close > open) // check this
longCond = longCond1 and longCond2 and longCond3
plotshape(series = plotLong ? longCond : na, title="Long", style=shape.triangleup, location=location.belowbar, color=color.green, text="Long", size=size.normal)

// Short Trades
sRsiCrossedDown = sRsiCrossDown or sRsiCrossDown[1]
vwapCrossedDown = vwapCrossDown or vwapCrossDown[1]
shortCond1 = (sRsiCrossedDown[1] and vwapCrossedDown[1])
shortCond2 = pivotPointCrossedDown[1]
shortCond3 = (close[1] < open[1]) and (close < open)
shortCond = shortCond1 and shortCond2 and shortCond3
plotshape(series = plotShort ? shortCond : na, title="Short", style=shape.triangledown, location=location.abovebar, color=color.red, text="Short", size=size.normal)

// alertcondition(condition=longCond, title="Long", message="Going long")
// alertcondition(condition=shortCond, title="Short", message="Going short")

// 🔥 Uncomment the lines below for the strategy and revert for the study
takeProfitLong     = strategy.position_avg_price * (1 + takeProfit)
takeProfitShort     = strategy.position_avg_price * (1 - takeProfit)
exitTp = ((strategy.position_size > 0) and (close > takeProfitLong)) or ((strategy.position_size < 0) and (close < takeProfitShort))
strategy.risk.allow_entry_in(tradingDirection == "L" ? strategy.direction.long : tradingDirection == "S" ? strategy.direction.short : strategy.direction.all)
plot(series = (plotTP and strategy.position_size > 0) ? takeProfitLong : na, title="TP Level",color=color.green, style=plot.style_linebr, linewidth=2)
plot(series = (plotTP and strategy.position_size < 0) ? takeProfitShort : na, title="TP Level",color=color.red, style=plot.style_linebr, linewidth=2)
inDateRange = (time >= timestamp(syminfo.timezone, startYear,
         startMonth, startDate, 0, 0)) and (time < timestamp(syminfo.timezone, endYear, endMonth, endDate, 0, 0))
strategy.entry("VWAP", strategy.long, comment="Long", when=longCond and inDateRange)
strategy.entry("VWAP", strategy.short, comment="Short", when=shortCond and inDateRange)
strategy.close(id="VWAP", when=exitTp)
if (not inDateRange)
    strategy.close_all()

More