Gradual Accumulation Breakout Trading Strategy

Overview
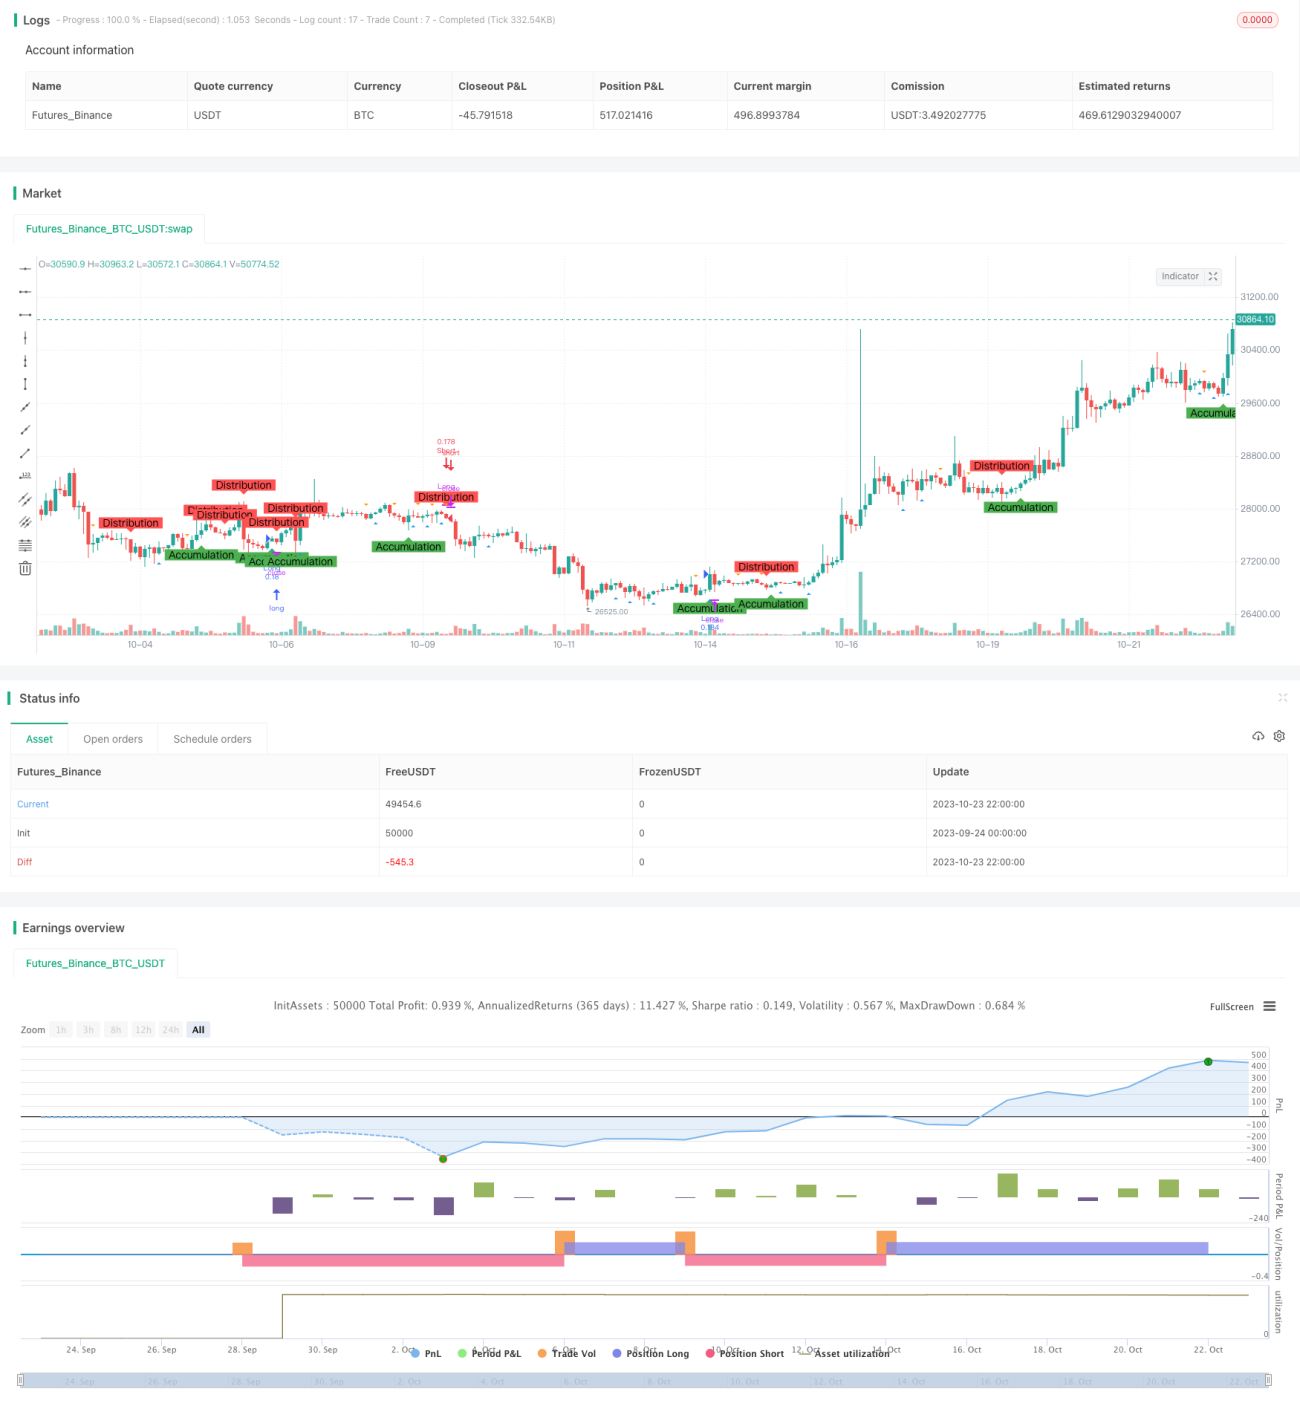
The Gradual Accumulation Breakout Trading Strategy aims to identify potential accumulation and distribution phases in the market using the principles of Wyckoff analysis, supplemented by the detection of spring and upthrust patterns, to seek potential buying and selling opportunities.
Strategy Logic
-
Use moving average crossovers of different lengths to identify accumulation and distribution phases. When the close price crosses above the MA of length AccumulationLength, it indicates an accumulation phase. When the close price crosses below the MA of length DistributionLength, it indicates a distribution phase.
-
Use moving average crossovers of different lengths to identify spring and upthrust patterns. When the low price crosses above the MA of length SpringLength, it indicates a spring. When the high price crosses below the MA of length UpthrustLength, it indicates an upthrust.
-
Go long when a spring is observed during an accumulation phase. Go short when an upthrust is observed during a distribution phase.
-
Set stop loss levels. The long stop loss is set at close * (1 - Stop Percentage%). The short stop loss is set at close * (1 + Stop Percentage%).
-
Plot shapes on the chart to indicate identified accumulation, distribution, spring and upthrust patterns for easy visual recognition.
Advantage Analysis
-
Identifying accumulation and distribution phases using Wyckoff analysis improves reliability of trading signals.
-
Confirming signals with spring and upthrust patterns provides further validation.
-
The stop loss helps control single trade loss.
-
Chart annotations clearly reveal the whole process of price coiling.
-
The adjustable parameters make this strategy optimizable across markets and timeframes.
Risk Analysis
-
Whipsaws may generate false signals during choppy price action.
-
Spring and upthrust may fail occasionally.
-
Stop loss being taken out could increase losses.
-
Incompatible parameters for different markets may cause incorrect signals.
-
Mechanical systems lack flexible discretionary control.
Optimization Directions
-
Test optimal parameter combinations across markets and timeframes.
-
Consider incorporating volume for signal confirmation.
-
Set dynamic stops based on market volatility.
-
Incorporate fundamental factors to avoid signals at major events.
-
Apply machine learning to dynamically optimize parameters.
Summary
The Gradual Accumulation Breakout Trading Strategy integrates Wyckoff analysis, moving averages, pattern recognition and other techniques to effectively identify coiling price action and generate trading signals. It has reliable signals, controlled risks, clear visuals and other advantages. As a mechanical system, its discretion and adaptability need improvement. Future optimizations involve parameter optimization, volume confirmation, stop loss enhancement, fundamental filters and more. Overall, this strategy provides effective decision support for intraday trading.
- 1