Breakout Scalper - Catching Trend Changes Quickly

Overview
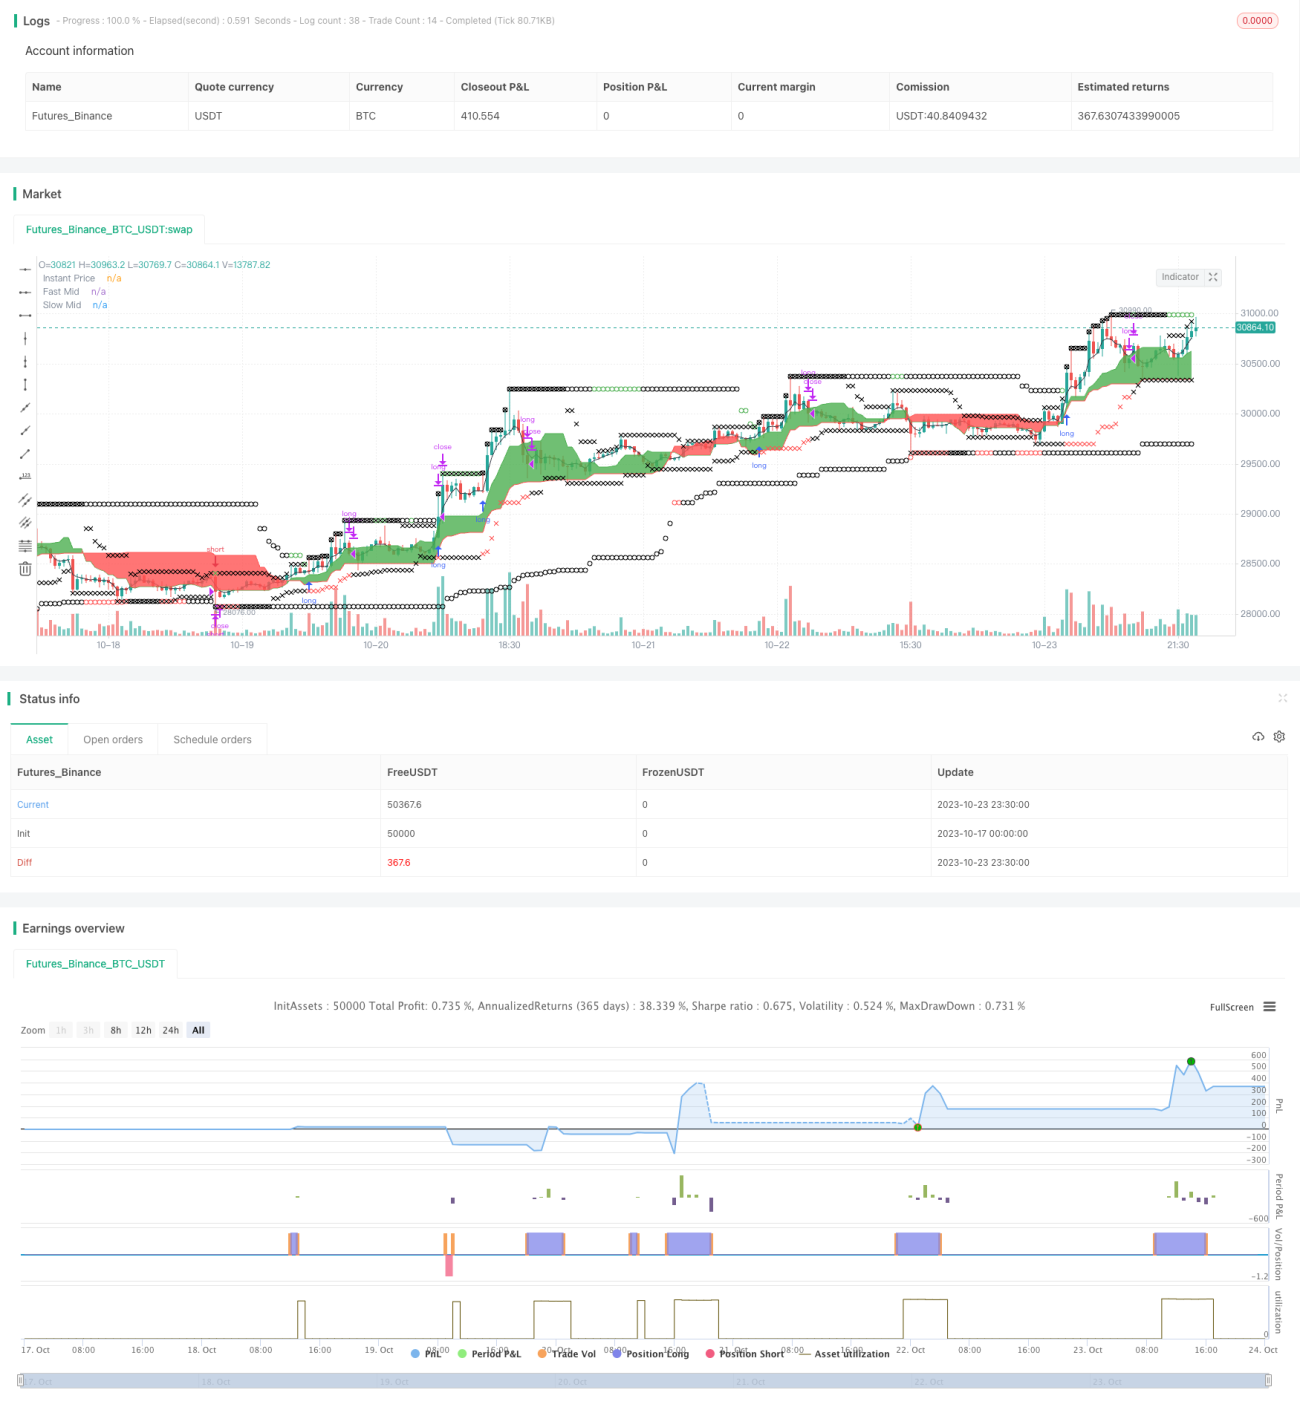
The Breakout Scalper strategy is a breakout trading strategy that utilizes fast and slow moving averages to identify trend changes. It sets up entry stops and trailing exit stops for risk management. The strategy closes positions manually when the market goes sideways. It is suitable for volatile instruments to capitalize on fast trend shifts.
Strategy Logic
The strategy employs a fast window and a slow window. The default periods are 13 and 52 respectively. The fast window captures short-term trends while the slow window determines overall market direction. The mid prices of the two windows are plotted. When the fast mid-price crosses above the slow mid-price, an uptrend may be forming. When the fast mid-price crosses below the slow one, a downtrend may be starting.
When the fast mid-price is above the slow mid-price, and the instant price is also above the fast mid-price, a buy signal is generated. The entry stop is placed at the slow window's highest price. When the fast mid-price is below the slow one, and the instant price is below the fast mid-price, a sell signal is triggered, with the entry stop at the slow window's lowest price.
In addition, exit stops are defined for risk control. The long exit stop is the max of the fast and slow windows' lowest prices. The short exit stop is the min of the fast and slow windows' highest prices. This ensures the stops are placed outside the current trend direction for risk mitigation.
Positions are closed when the entry conditions are no longer valid, avoiding unnecessary losses during sideways markets.
Advantage Analysis
The key advantages of this strategy include:
-
Quickly catches trend changes suitable for volatile assets. The combination of the fast and slow windows enables responsive trend change detection.
-
Effective risk management via reasonable stops. The stops allow timely exits to control losses.
-
Simple and clear logic based on moving average crosses and stops. Easy to understand and implement.
-
Easily optimizable and extensible. Parameters can be tuned and more indicators can be added.
Risk Analysis
The main risks are:
-
Fast window prone to noise. Market noise can generate incorrect signals.
-
Slow window lag. Turning points may be detected late.
-
Stops too close to market. Stops based directly on window prices may be too tight.
-
Sideways markets lead to whipsaws. Choppy markets generate false signals.
Mitigations:
-
Optimize fast window and add filters.
-
Improve slow window and add confirming indicators.
-
Buffer stops from market price.
-
Detect sideways and avoid signals.
Optimization Opportunities
The strategy can be enhanced in several aspects:
-
Optimize window periods for different assets.
-
Add position sizing for better risk control.
-
Implement profit taking mechanisms.
-
Add more filters to create robust signals.
-
Incorporate pattern detection like triangles and divergences.
-
Utilize machine learning to optimize parameters.
Conclusion
The Breakout Scalper aims to catch trend changes quickly based on fast and slow moving average crosses. It is suitable for volatile markets like gold. The stops provide risk management. The simple logic makes it easy to understand and optimize. The identified risks and enhancements offer ways to improve the strategy further. Overall, this is an efficient trend trading system that can be refined into a robust approach.
- 1