Dual Moving Average Reversal and Triple Bottom Flash Combo Trading Strategy

Overview
This trading strategy makes full use of the advantages of moving average reversal and triple bottom flash technical indicators for combo application. It captures reversal opportunities while tracking the trend, filtering out some false breakout signals, and can effectively improve the win rate of trading systems.
Strategy Principles
The strategy consists of two parts:
-
Combination of 2-day and 20-day moving averages. Buy and sell signals are generated when the 2-day moving average diverges from the 20-day moving average.
-
Triple bottom flash pattern. The emergence of this pattern is a signal for short-term reversal. The forming condition is: the lowest of the middle day is lower than the previous and the next day, and the closing price of the next day is higher than the highest of the previous day.
When the 2-day and 20-day moving averages simultaneously show reversal signals, and are consistent with the direction of the triple bottom flash pattern signal, take buy or sell actions.
In the code, the 2-day and 20-day moving averages are calculated first. When the 2-day moving average breaks through the 20-day moving average up or down, buy/sell signals are generated.
When the triple bottom flash pattern is detected, the pattern direction signal is set to 1 or -1. Read the pattern signal of the previous day, combine it with the current moving average signal, and generate the final entry signal.
Thus, by filtering with the combination of moving averages and patterns, some false signals can be filtered out, making the trading strategy more reliable.
Advantages
-
The combination of multiple technical indicators can complement and verify each other and improve signal reliability.
-
Moving average reversal can capture reversal points of trends in a timely manner and take advantage of reversals. The triple bottom flash can further confirm the reversal formation.
-
The 20-day moving average tracks the medium and long term trends, and the 2-day moving average captures entry points after short-term adjustments. The combination of multiple time frames can fully grasp the trend.
-
The strategy is not sensitive to parameters and is easy to implement and optimize.
Risks
-
Reversal patterns are prone to misjudgment and experience is needed to judge their reliability.
-
Reversal signals may lag, requiring observation of pattern features and appropriate position adjustment.
-
Testing and optimization are needed for different trading varieties, and some parameters may need to be adjusted.
-
Loss control needs to introduce a stop loss mechanism to avoid missing important reversal points.
Optimization
-
Test different moving average combinations to select the best parameters for the variety.
-
Introduce other auxiliary indicators such as volume, Bollinger Bands, etc. for multi-indicator verification.
-
Add a stop loss module to control drawdowns and risks.
-
Optimize entry timing to avoid premature or late problems.
-
Perform parameter optimization for specific varieties to improve adaptability.
Summary
The strategy makes full use of the advantages of moving average reversal and short-term patterns to achieve effective combination of both, which can improve the stability and win rate of trading systems. But risk control, parameter testing and optimization are needed to adapt to the characteristics of different varieties. Overall, the strategy has a simple and clear structure that is easy to implement and is a practical trend reversal trading strategy.
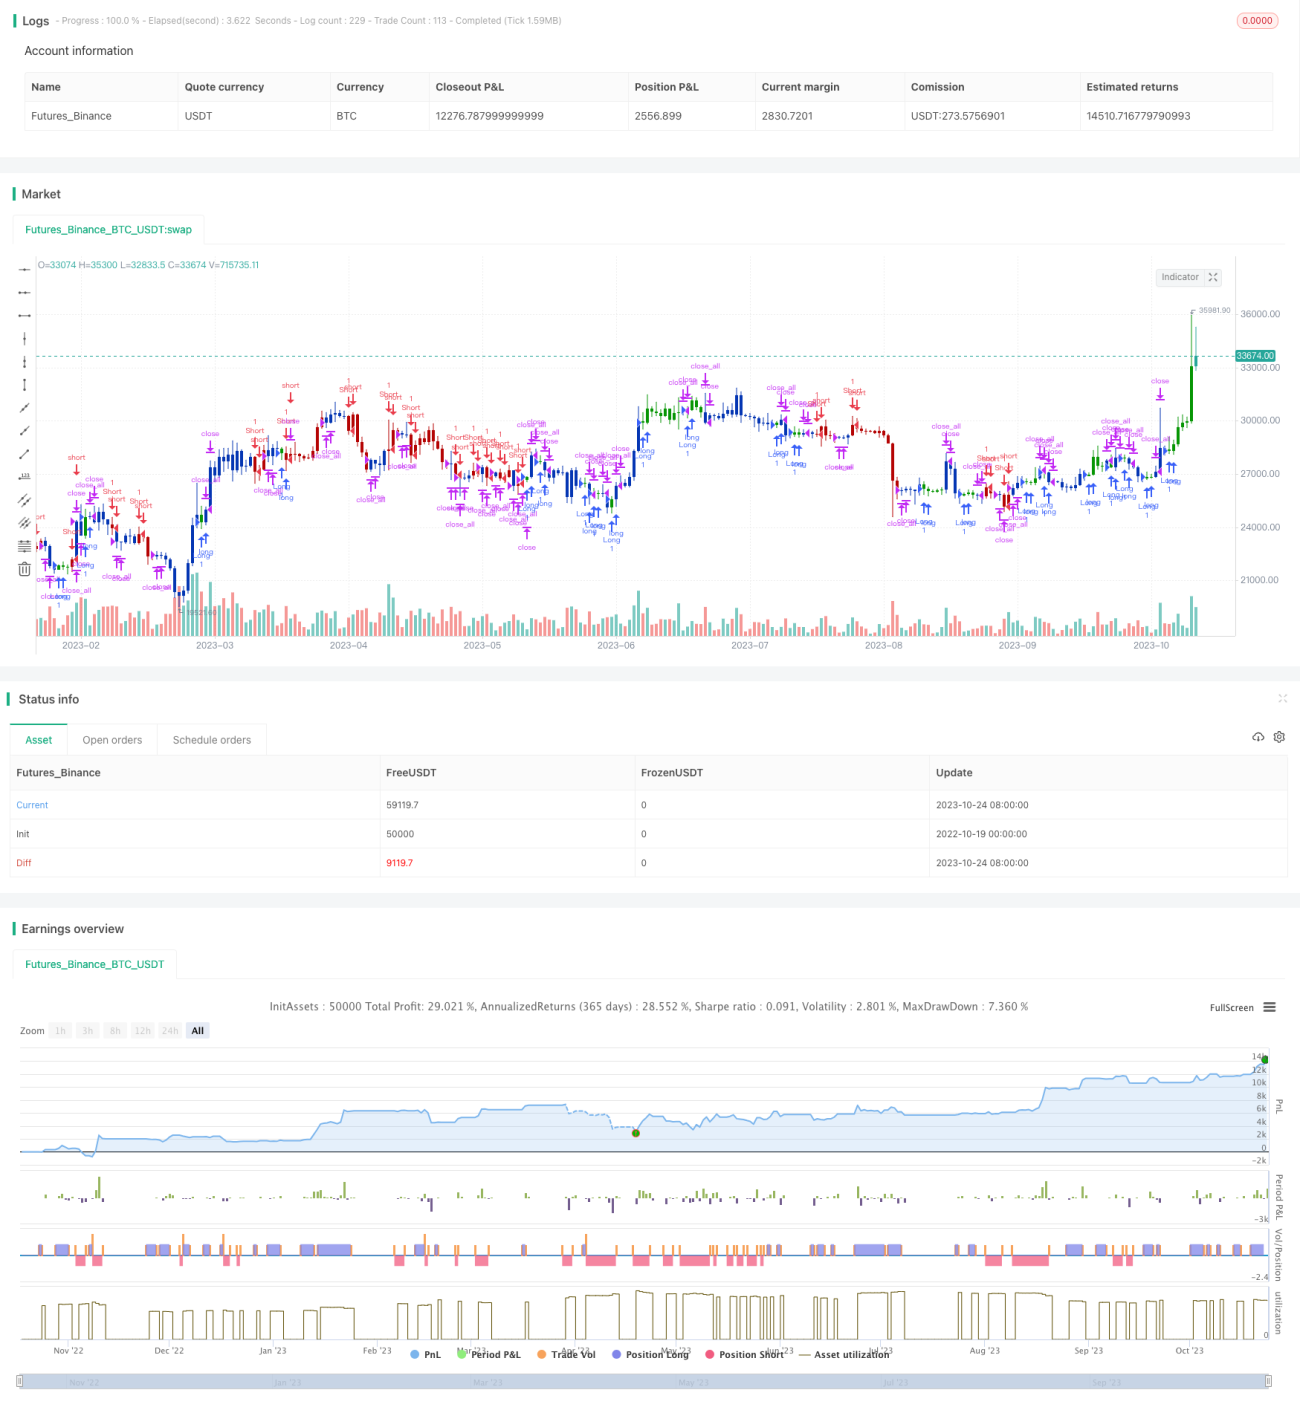
/*backtest
start: 2022-10-19 00:00:00
end: 2023-10-25 00:00:00
period: 1d
basePeriod: 1h
exchanges: [{"eid":"Futures_Binance","currency":"BTC_USDT"}]
*/

//@version=4
////////////////////////////////////////////////////////////
//  Copyright by HPotter v1.0 25/12/2021
// This is combo strategies for get a cumulative signal. - 1