Dual Stochastics and Volume Weighted Moving Average Combination Indicator Strategy

Overview
This is a strategy that utilizes a combination of dual Stochastics indicators and Volume Weighted Moving Average to identify trends. It uses two Stochastics indicators with different periods, one short-term and one long-term, combined with VWMA to determine the current trend direction.
Strategy Logic
The strategy mainly implements trend identification through the following parts:
-
Calculate a short-period Stochastics indicator with period length input(30) and smooth parameter 2
-
Calculate a long-period Stochastics indicator with period length input(90) and smooth parameter 2
-
Add the short-period and long-period Stochastics together to get a combined Stochastics curve ts
-
Calculate a Volume Weighted Moving Average of ts curve with period length input(30)
-
Compare current tsl value with its value 1 period ago, when tsl rises, it indicates an uptrend, when tsl falls, it indicates a downtrend
-
Combine with Stochastics curve position to identify bullish or bearish signals
- When tsl rises and ts is in middle zone, it is a bullish signal
- When tsl falls and ts is in middle zone, it is a bearish signal
Advantage Analysis
The strategy combines trend identification and overbought-oversold analysis, which can identify trend direction quite reliably. The advantages are:
-
The dual Stochastics can reflect both short-term and long-term overbought/oversold situations, avoiding missing some signals
-
Volume weighted moving average can filter out some false breakout signals
-
Stochastics curve position re-confirms the reliability of trend signals
-
Adjustable parameters suit different markets
-
Clear and simple logic, easy to understand and modify
Risks and Improvements
There are also some risks to note for this strategy:
-
Stochastics may give false signals, needs filtering with longer-period indicators
-
Fixed periods may not suit all markets, dynamic optimization could help
-
Purely technical indicator based, fundamentals may improve accuracy
-
Inaccurate volume data affects results, need to verify data quality
-
Insufficient backtesting history, more data needed for validation
-
Entry points can be improved, rather than direct long on crosses under lowest
Conclusion
In summary, this strategy identifies trends using dual Stochastics and VWMA, which can reliably identify trend reversals in theory. But parameter tuning is needed for specific markets, and false signals risk exists. Recommend combining other factors like fundamentals, long-term trends etc for judgment, to improve strategy Profit Factor. The logic is simple and clear, providing a template for quant trading, which can be modified as needed. It has great application value.
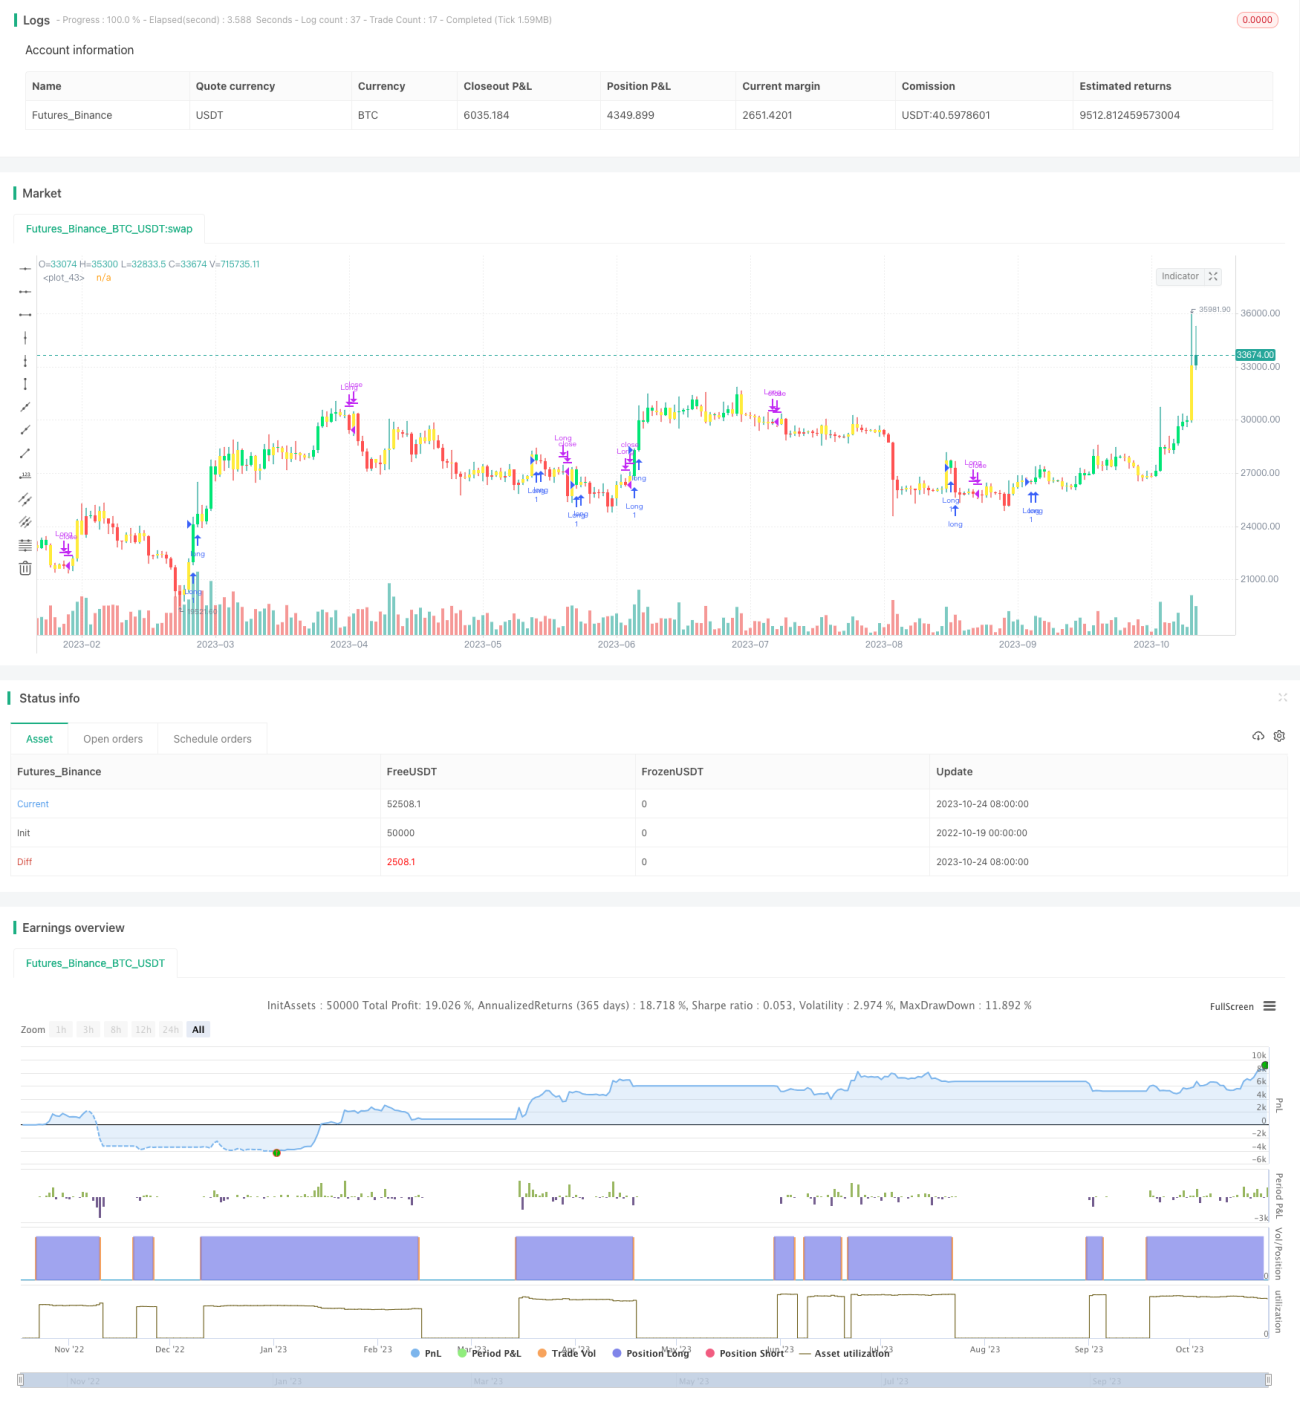
/*backtest
start: 2022-10-19 00:00:00
end: 2023-10-25 00:00:00
period: 1d
basePeriod: 1h
exchanges: [{"eid":"Futures_Binance","currency":"BTC_USDT"}]
*/

//@version=4
strategy(title="Trend Finder V2", shorttitle="TFV2", format=format.price, precision=2, overlay = true)

//----------Indicator------------//- 1