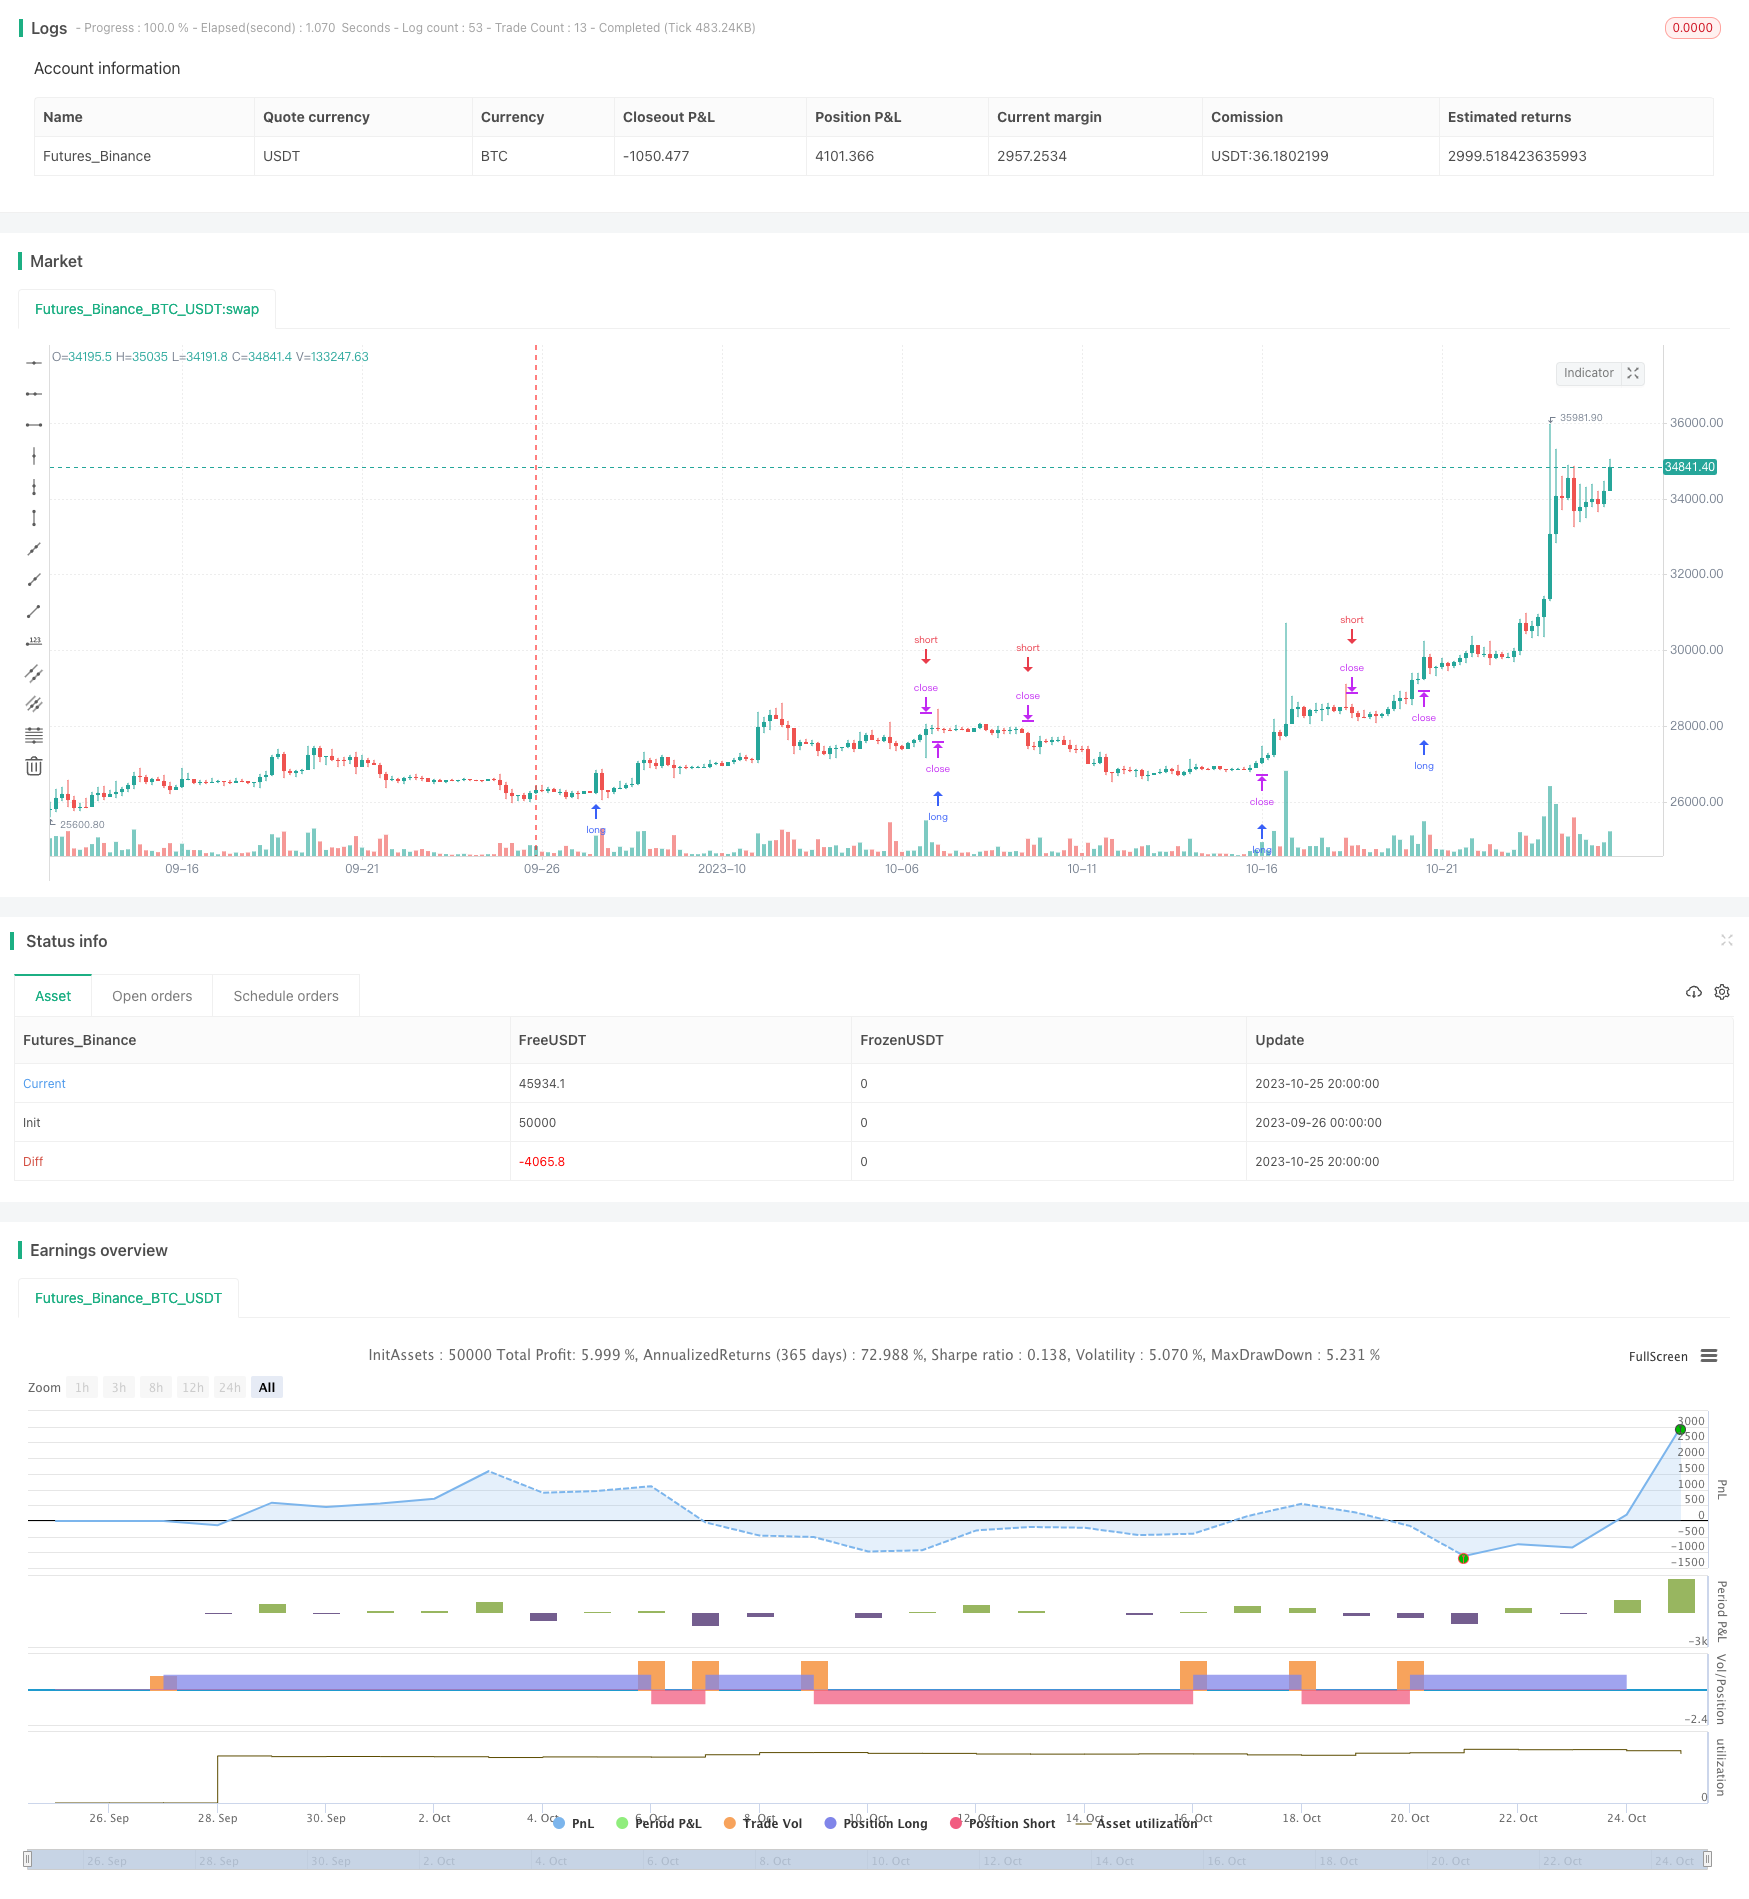
概述
该策略基于抛物线转向系统指标,结合时间窗口进行回测,实现动量追踪止损的效果。策略主要适用于趋势性较强的品种,通过动态调整止损点,实现趋势跟踪止损。
策略原理
该策略使用抛物线转向系统(Parabolic SAR)作为主要技术指标。Parabolic SAR可以提供非常准确的反转信号。当股价处于上涨趋势时,Parabolic SAR会不断上移,为追踪上涨提供支撑。当股价开始下跌时,Parabolic SAR会快速下移,为止损提供信号。
策略首先设置Parabolic SAR的三个参数,包括初始值、步进值和最大值。然后计算Parabolic SAR的值。策略以Parabolic SAR作为动态止损点。当股价上涨时,在Parabolic SAR之上做多;当股价跌破Parabolic SAR时,平掉做多单子。同理,当股价下跌时,在Parabolic SAR之下做空;当股价突破Parabolic SAR时,平掉做空单子。
这样,策略可以在股价处于趋势状态时,进行趋势跟踪;当股价开始反转时,快速止损,完成一次交易周期。
优势分析
- 利用Parabolic SAR指标的高效性,可以提供准确的做多做空信号
- Parabolic SAR指标可以快速响应价格变化,进行及时止损
- 自动调整止损点,无需人工干预,避免错失止损机会
- 可以深度定制Parabolic SAR的参数,使止损点更符合自己的风格
- 回测指定时间窗口,可以检查策略在不同市场环境下的表现
风险分析
- 难以把握最佳的Parabolic SAR参数组合,不当的参数可能带来止损过于激进或保守
- 依赖单一指标Parabolic SAR,容易受到异常波动的影响
- 该策略更适合趋势性行情,盘整时容易止损过于频繁
- 需要选择合适的时间窗口进行回测,测试样本不全面可能导致结果偏差
- 回测仅考虑历史数据,无法预测未来行情,实盘表现可能和回测不符
优化方向
- 可以考虑结合其他指标,形成指标组合,提高策略的稳定性
- 增加参数优化模块,实现Parabolic SAR参数的自动优化
- 增加仓位和订单管理模块,控制每笔交易的资金利用率
- 增加止损方式的选择,如移动止损、挂单止损等,使策略更全面
- 优化时间窗口的选择,检验不同市场环境下的策略稳定性
- 增加机器学习模块,利用AI技术实现策略参数的动态优化
总结
该策略充分利用Parabolic SAR指标提供的高效止损功能,实现了动量追踪止损的效果。相比固定止损点,该策略可以动态调整,自动跟踪趋势进行止损,避免仓位过早被止损。同时,策略风险也不能忽视,需要多方面进行优化和丰富,使策略在不同市场中保持稳定的表现。总体来说,该策略为跟踪趋势提供了效果明显的止损方式,值得进一步研究和应用。
策略源码
/*backtest
start: 2023-09-26 00:00:00
end: 2023-10-26 00:00:00
period: 4h
basePeriod: 15m
exchanges: [{"eid":"Futures_Binance","currency":"BTC_USDT"}]
*/

//@version=3
// === by @Aldovitch ===
// PSAR Strategy
// Based on Parabolic SAR Strategy provided by TradingView
// added a Time Window for Backtests
//
strategy("Parabolic SAR Strategy w/ Time Window", shorttitle="PSAR Strategy w/ TW", overlay=true)

// === INPUT INDEXES PARAMETERS ===
start = input(0.02)
increment = input(0.02)
maximum = input(0.2)

// === INPUT BACKTEST RANGE ===
FromDay   = input(defval = 1, title = "From Day", minval = 1, maxval = 31)
FromMonth = input(defval = 1, title = "From Month", minval = 1, maxval = 12)
FromYear  = input(defval = 2018, title = "From Year", minval = 2016)
ToDay     = input(defval = 1, title = "To Day", minval = 1, maxval = 31)
ToMonth   = input(defval = 12, title = "To Month", minval = 1, maxval = 12)
ToYear    = input(defval = 9999, title = "To Year", minval = 2017)


// === CONTROL & APPEARENCE ===
timeStart     = timestamp(FromYear, FromMonth, FromDay, 00, 00)  // backtest start window
timeFinish    = timestamp(ToYear, ToMonth, ToDay, 23, 59)        // backtest finish window

// === FUNCTIONS ===
window()  => true // create function "within window of time"


// === COMPUTING INDEXES ===
psar = sar(start, increment, maximum)


if (psar > high)
    strategy.entry("ParLE", strategy.long, stop=psar, comment="ParLE", when=window())
else
    strategy.cancel("ParLE")

if (psar < low)
    strategy.entry("ParSE", strategy.short, stop=psar, comment="ParSE", when=window())
else
    strategy.cancel("ParSE")

//plot(strategy.equity, title="equity", color=red, linewidth=2, style=areabr)