Seasonal Range Moving Average RSI Strategy

Overview
This strategy combines moving average and relative strength index (RSI), two technical indicators, to capture seasonal cyclical characteristics and generate trading signals. The advantage of this strategy is that it can identify seasonal trends very clearly, but it also has the risk of being misled by wrong signals. Further optimizations can be made by adjusting parameter settings to improve strategy performance.
Strategy Logic
The strategy first calculates the moving average of a certain period n to capture the medium-to-long term trend direction. Then it calculates the RSI indicator of the moving average to judge whether it is currently in an overbought or oversold state. RSI measures market sentiment by calculating the ratio of gains versus losses over a certain period.
When RSI crosses above the lower band, a buy signal is generated, indicating an oversold status, and a long position can be opened. When RSI crosses below the upper band, a sell signal is generated, indicating an overbought status, and a short position can be opened. In addition, the strategy also sets the range for month and date to trade only during specific months and days, in order to capture seasonal patterns.
Advantages of the Strategy
-
Utilize moving average to determine the major trend, and RSI to judge overbought/oversold scenarios, combining dual indicators to improve accuracy
-
Setting monthly and date range can effectively identify seasonal trends and capture such trading opportunities
-
Flexible RSI parameter settings to adjust sensitivity in determining overbought/oversold levels
-
Customizable moving average parameters to adapt sensitivity in judging major trends
Risks and Solutions
-
Risk of being misled by wrong signals, e.g. trend reversals triggered by non-seasonal events, may generate improper trading signals. Solution is to adjust monthly and date range to avoid potential event risks.
-
Divergence may appear between moving average and RSI when trend is reversing. Solution is to properly shorten moving average period to capture trend turns faster.
-
Preset monthly and date range may deviate from actual seasonal trends. Solution is to determine a more precise seasonal range based on historical data testing.
-
Trading signals may encounter false breakouts. Solution is to set wider range to avoid being misled by minor fluctuations.
Optimization Directions
-
Introduce other auxiliary indicators, e.g. Stochastic Oscillator, to set more stringent filtering conditions and reduce wrong signals.
-
Test more different parameter combinations to find optimum parameters and improve strategy performance, e.g. adjust moving average period, RSI bands etc.
-
Utilize parameter optimization methods to automatically search parameter space for optimal parameter sets.
-
Collect more historical data and utilize machine learning to train and optimize strategy rules.
-
Consider adding stop loss/take profit strategies to optimize money management.
Summary
This strategy combines moving average and RSI, with the addition of seasonal judgments, to form a relatively complete system for trend and overbought/oversold identification. The advantage lies in its ability to clearly recognize seasonal patterns and capitalize on such trading opportunities. There are certain risks of being misled, but optimizations can be made via parameter tuning, introducing auxiliary indicators, machine learning etc. to elevate strategy performance. Overall, this strategy provides a reliable and effective seasonal trading framework that is worth live testing and application.
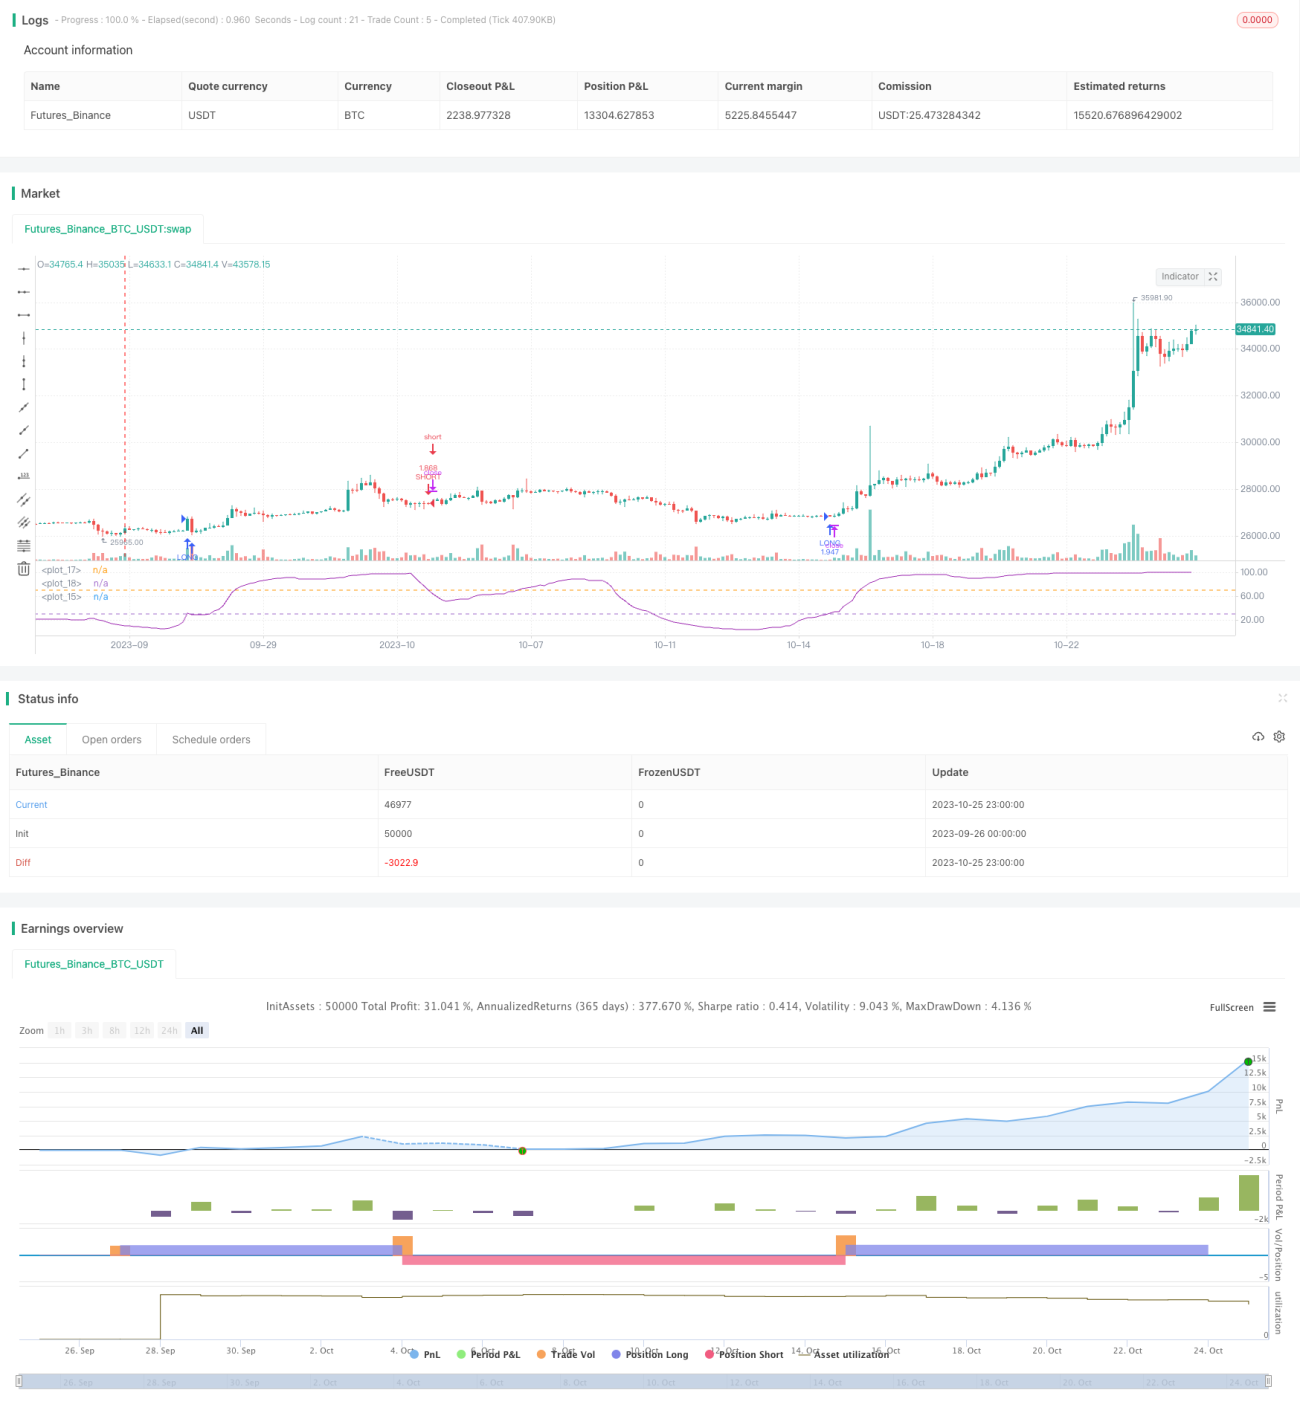
/*backtest
start: 2023-09-26 00:00:00
end: 2023-10-26 00:00:00
period: 3h
basePeriod: 15m
exchanges: [{"eid":"Futures_Binance","currency":"BTC_USDT"}]
*/

//@version=2
strategy(title = " RSI of MA Strategy ",shorttitle="MARSI Strategy",default_qty_type = strategy.percent_of_equity, default_qty_value = 100,commission_type=strategy.commission.percent,commission_value=0.1,initial_capital=1)
- 1