资源加载中... loading...

Breakout Swing Strategy

Author: ChaoZhang, Date: 2023-10-27 16:26:33
Tags:

img

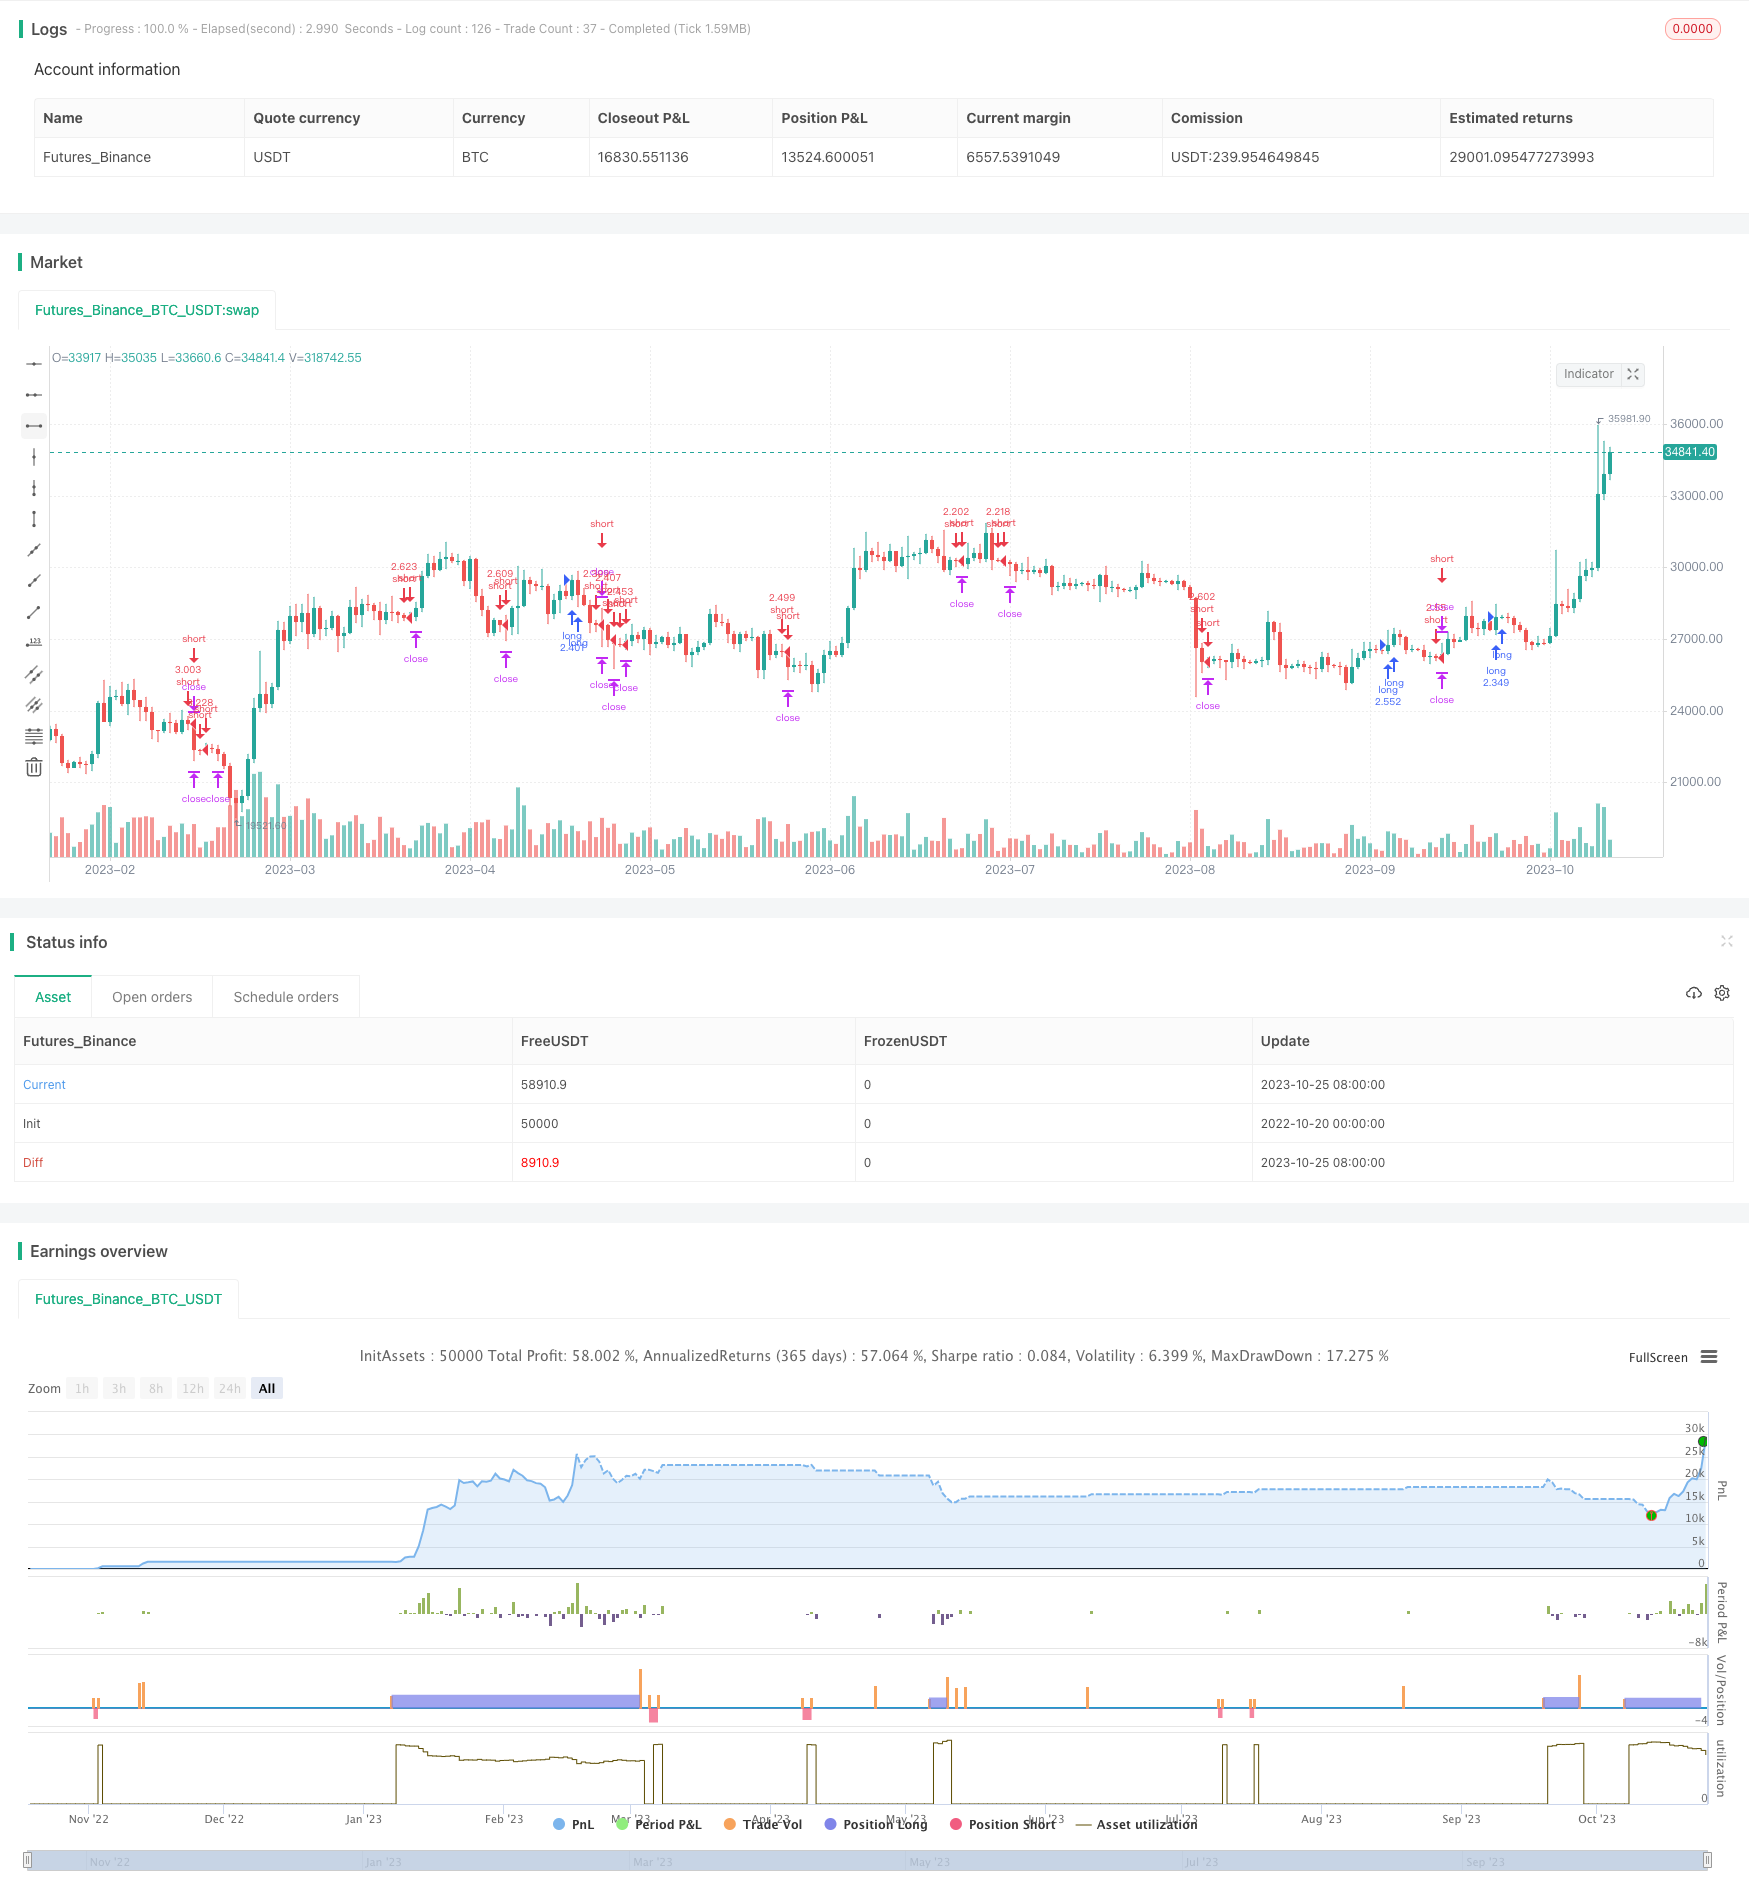
Overview

This strategy mainly uses the price swing range and trend judgment of K-line to find trading opportunities. It will send trading signals when the price breaks through the high or low points of the previous K-line. When the trend goes up, go long when the price breaks through the high point; When the trend goes down, go short when the price breaks through the low point.

Strategy Principle

This strategy is mainly based on two points:

  1. Klinger Oscillator to judge the trend direction. When the indicator is greater than 0, it indicates a bullish trend, and when it is less than 0, it indicates a bearish trend.

  2. The price breaks through the highest price or the lowest price of the previous K-line. Go long in an uptrend when breaking through the highest price, and go short in a downtrend when breaking through the lowest price.

Specifically, the entry logic of the strategy is as follows:

Long entry:

  1. The current K-line high point is greater than the previous K-line high point
  2. The current K-line low point is less than the previous K-line low point
  3. Klinger Oscillator is greater than 0, indicating a bullish trend
  4. The close price of the current K-line crosses above the Hull moving average
  5. The current K-line is a bullish K-line (close price is higher than open price)

Short entry:

  1. The current K-line high point is less than the previous K-line high point
  2. The current K-line low point is greater than the previous K-line low point
  3. Klinger Oscillator is less than 0, indicating a bearish trend
  4. The close price of the current K-line crosses below the Hull moving average
  5. The current K-line is a bearish K-line (close price is lower than open price)

After entering the market, the stop loss or take profit price is set according to a certain percentage of the entry price.

Advantage Analysis

The main advantages of this strategy are:

  1. Able to capture opportunities in time when trend turns. Increase profit probability.

  2. Use Klinger Oscillator to determine trend direction, avoid trading without direction in oscillating market.

  3. Combine moving average to filter false breakout.

  4. Controllable risks, reasonable stop loss and take profit.

Risk Analysis

The main risks of this strategy are:

  1. There may be more stop loss in oscillating market.

  2. Improper moving average parameter setting may cause misjudgment.

  3. Failed breakout may lead to pullback loss.

  4. Loss may expand when trend reverses.

  5. Frequent trading, high commission costs.

Risks can be controlled by optimizing parameters to find more suitable moving average periods to reduce misjudgment. Set reasonable stop loss distance to control single loss. Trade varieties with obvious trend. Appropriately reduce trading frequency.

Optimization Directions

This strategy can be optimized in the following aspects:

  1. Optimize moving average parameters to find parameters with higher smoothness to reduce noise.

  2. Test different indicators to determine the trend and find more reliable determination indicators.

  3. Optimize stop loss and take profit strategies to make them more in line with market statistical characteristics.

  4. Increase trend filtering to avoid false breakouts in oscillating markets.

  5. Add trading time and variety filtering to select trading hours and varieties.

  6. Research parameter settings for different time cycles.

Summary

In general, this is a relatively simple and practical breakout strategy. Its advantages are controllable risks and avoid directionless trading by using indicators. But need to pay attention to prevent false breakout in oscillating market and timely stop loss. Further improve the strategy success rate through parameter optimization and enhancing indicator reliability. This strategy is suitable for markets with obvious trends. If used in varieties and time cycles with stronger oscillation, the results may be compromised.


/*backtest
start: 2022-10-20 00:00:00
end: 2023-10-26 00:00:00
period: 1d
basePeriod: 1h
exchanges: [{"eid":"Futures_Binance","currency":"BTC_USDT"}]
*/

// This source code is subject to the terms of the Mozilla Public License 2.0 at https://mozilla.org/MPL/2.0/
// © exlux99

//@version=4
strategy("Advanced OutSide Forex strategy", overlay = true, default_qty_type = strategy.percent_of_equity, default_qty_value = 100, calc_on_every_tick = true, commission_type = strategy.commission.percent, commission_value = 0.0)

sv = change(hlc3) >= 0 ? volume : -volume
kvo = ema(sv, 34) - ema(sv, 55)
sig = ema(kvo, 13)

length = input(title="Length", type=input.integer, defval=27)
src = input(close, title="Source")
lsma = hma(src, length)

if (high > high[1] and low < low[1])
	if (close > open and kvo>0 and lsma<close)
		strategy.entry("long", strategy.long, comment="long")
if (high < high[1] and low > low[1])		
	if (close < open and kvo<0 and lsma>close)
		strategy.entry("short", strategy.short, comment="short")

tplong=input(0.006, step=0.001, title="Take profit % for long")
sllong=input(0.012, step=0.001, title="Stop loss % for long")
tpshort=input(0.0075, step=0.001, title="Take profit % for short")
slshort=input(0.015, step=0.001, title="Stop loss % for short")


strategy.exit("short_tp/sl", "long", profit=close * tplong / syminfo.mintick, loss=close * sllong / syminfo.mintick, comment='LONG EXIT',  alert_message = 'closeshort')
strategy.exit("short_tp/sl", "short", profit=close * tpshort / syminfo.mintick, loss=close * slshort / syminfo.mintick, comment='SHORT EXIT',  alert_message = 'closeshort')

template: strategy.tpl:40:21: executing "strategy.tpl" at <.api.GetStrategyListByName>: wrong number of args for GetStrategyListByName: want 7 got 6