Momentum Breakout Reversal Trading Strategy

Author: ChaoZhang, Date: 2023-10-27 17:04:48
Tags:

img

Overview

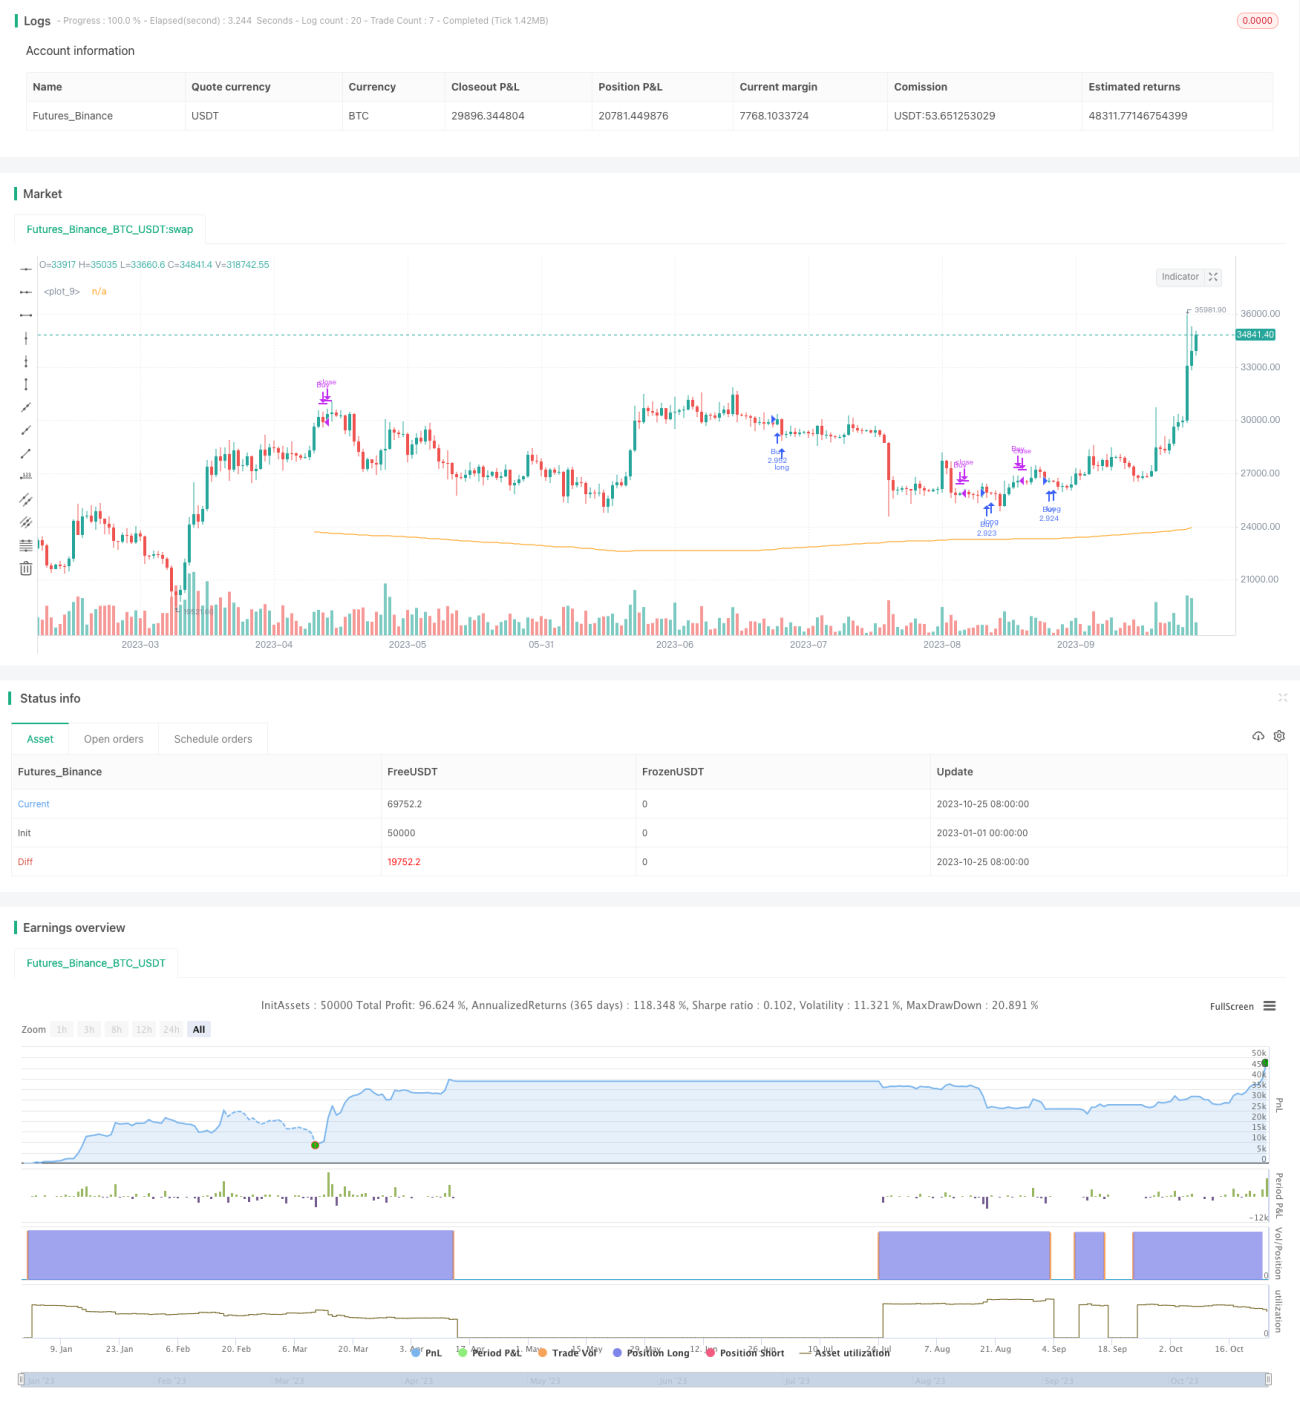
This strategy uses simple moving average to determine the trend direction and go long in an uptrend and go short in a downtrend to implement reversal trading.

Strategy Logic

This strategy uses Weighted Moving Average (VWMA) to determine the market trend direction. It goes long when VWMA is rising and goes short when VWMA is falling.

Specifically, it first calculates VWMA of a certain period, and then judges if VWMA has risen for over 5 days. If so, it opens long position. If VWMA has fallen for over 5 days, it opens short position. The closing condition is when VWMA direction reverses for over 5 days.

To calculate monthly and yearly returns, the strategy records the profit/loss of each month and year. By comparing the returns of this strategy with market benchmark, we can visually see the relative performance.

Advantage Analysis

The advantages of this strategy include:

  1. Using VWMA to determine trend can filter market noise effectively and capture major trends.

  2. Opening position only after trend is confirmed can avoid risks associated with trend reversal.

  3. Reversal trading can profit from both uptrend and downtrend.

  4. Recording monthly and yearly returns facilitates evaluating strategy performance.

  5. Adding market benchmark returns enables direct comparison between strategy and market.

Risk Analysis

Some risks of this strategy:

  1. Using VWMA to determine trend may lag and miss opportunities at beginning of the trend.

  2. Opening position only after confirmation may miss some movements.

  3. Reversal trading needs to set stop loss, otherwise loss could enlarge.

  4. Significant market fluctuation may trigger stop loss and unable to hold entire trend.

  5. Trend reversal judgement may be inaccurate, enlarging losses.

Optimization Directions

Some aspects that could optimize the strategy:

  1. Optimize VWMA period parameter to improve trend determination.

  2. Adjust number of days to confirm trend, improving entry and exit timing.

  3. Add stop loss strategy to control single trade loss.

  4. Incorporate other indicators to determine reversals, improving certainty.

  5. Optimize position sizing based on market condition.

  6. Consider trading cost, set minimum profit target.

Summary

The overall logic of this strategy is simple and clear, using VWMA to determine trend direction and reversal trade after confirmation, which can effectively track market moves. But it also has some risks, requiring further testing and parameter tuning, adjusting entry/exit logic, and appropriate position sizing. This basic reversal trading strategy lays the foundation for quantitative trading and is worth further research and improvement.


/*backtest
start: 2023-01-01 00:00:00
end: 2023-10-26 00:00:00
period: 1d
basePeriod: 1h
exchanges: [{"eid":"Futures_Binance","currency":"BTC_USDT"}]
*/

//@version=4
strategy(title="Monthly Returns in Strategies with Market Benchmark", shorttitle="Monthly P&L With Market", initial_capital= 1000, overlay=true,default_qty_type = strategy.percent_of_equity, default_qty_value = 100, commission_type = strategy.commission.percent, commission_value = 0.1)
maLength= input(400)

wma= vwma(hl2,maLength)
uptrend= rising(wma, 5)
downtrend= falling(wma,5)

plot(wma)

if uptrend
    strategy.entry("Buy", strategy.long)
else
    strategy.close("Buy")//

///////////////////
// MONTHLY TABLE //

new_month = month(time) != month(time[1])
new_year  = year(time)  != year(time[1])

eq = strategy.equity

bar_pnl = eq / eq[1] - 1
bar_bh = (close-close[1])/close[1]

cur_month_pnl = 0.0
cur_year_pnl  = 0.0
cur_month_bh = 0.0
cur_year_bh  = 0.0

// Current Monthly P&L
cur_month_pnl := new_month ? 0.0 : 
                 (1 + cur_month_pnl[1]) * (1 + bar_pnl) - 1 
cur_month_bh := new_month ? 0.0 : 
                 (1 + cur_month_bh[1]) * (1 + bar_bh) - 1

// Current Yearly P&L
cur_year_pnl := new_year ? 0.0 : 
                 (1 + cur_year_pnl[1]) * (1 + bar_pnl) - 1
cur_year_bh := new_year ? 0.0 : 
                 (1 + cur_year_bh[1]) * (1 + bar_bh) - 1

// Arrays to store Yearly and Monthly P&Ls
var month_pnl  = array.new_float(0)
var month_time = array.new_int(0)
var month_bh  = array.new_float(0)

var year_pnl  = array.new_float(0)
var year_time = array.new_int(0)
var year_bh  = array.new_float(0)

last_computed = false

if (not na(cur_month_pnl[1]) and (new_month or time_close + (time_close - time_close[1]) > timenow or barstate.islastconfirmedhistory))
    if (last_computed[1])
        array.pop(month_pnl)
        array.pop(month_time)
        
    array.push(month_pnl , cur_month_pnl[1])
    array.push(month_time, time[1])
    array.push(month_bh , cur_month_bh[1])

if (not na(cur_year_pnl[1]) and (new_year or time_close + (time_close - time_close[1]) > timenow or barstate.islastconfirmedhistory))
    if (last_computed[1])
        array.pop(year_pnl)
        array.pop(year_time)
        
    array.push(year_pnl , cur_year_pnl[1])
    array.push(year_time, time[1])
    array.push(year_bh , cur_year_bh[1])

last_computed := (time_close + (time_close - time_close[1]) > timenow or barstate.islastconfirmedhistory) ? true : nz(last_computed[1])

// Monthly P&L Table    
var monthly_table = table(na)

getCellColor(pnl, bh)  => 
    if pnl > 0
        if bh < 0 or pnl > 2 * bh
            color.new(color.green, transp = 20)
        else if pnl > bh
            color.new(color.green, transp = 50)
        else
            color.new(color.green, transp = 80)
    else
        if bh > 0
            color.new(color.red, transp = 20)
        else if pnl < bh
            color.new(color.red, transp = 50)
        else
            color.new(color.red, transp = 80)

if last_computed
    monthly_table := table.new(position.bottom_right, columns = 14, rows = array.size(year_pnl) + 1, border_width = 1)

    table.cell(monthly_table, 0,  0, "",     bgcolor = #cccccc)
    table.cell(monthly_table, 1,  0, "Jan",  bgcolor = #cccccc)
    table.cell(monthly_table, 2,  0, "Feb",  bgcolor = #cccccc)
    table.cell(monthly_table, 3,  0, "Mar",  bgcolor = #cccccc)
    table.cell(monthly_table, 4,  0, "Apr",  bgcolor = #cccccc)
    table.cell(monthly_table, 5,  0, "May",  bgcolor = #cccccc)
    table.cell(monthly_table, 6,  0, "Jun",  bgcolor = #cccccc)
    table.cell(monthly_table, 7,  0, "Jul",  bgcolor = #cccccc)
    table.cell(monthly_table, 8,  0, "Aug",  bgcolor = #cccccc)
    table.cell(monthly_table, 9,  0, "Sep",  bgcolor = #cccccc)
    table.cell(monthly_table, 10, 0, "Oct",  bgcolor = #cccccc)
    table.cell(monthly_table, 11, 0, "Nov",  bgcolor = #cccccc)
    table.cell(monthly_table, 12, 0, "Dec",  bgcolor = #cccccc)
    table.cell(monthly_table, 13, 0, "Year", bgcolor = #999999)


    for yi = 0 to array.size(year_pnl) - 1
        table.cell(monthly_table, 0,  yi + 1, tostring(year(array.get(year_time, yi))), bgcolor = #cccccc)
        
        y_color = getCellColor(array.get(year_pnl, yi), array.get(year_bh, yi))
        table.cell(monthly_table, 13, yi + 1, tostring(round(array.get(year_pnl, yi) * 100)) + " (" + tostring(round(array.get(year_bh, yi) * 100)) + ")", bgcolor = y_color)
        
    for mi = 0 to array.size(month_time) - 1
        m_row   = year(array.get(month_time, mi))  - year(array.get(year_time, 0)) + 1
        m_col   = month(array.get(month_time, mi)) 
        m_color = getCellColor(array.get(month_pnl, mi), array.get(month_bh, mi))
        
        table.cell(monthly_table, m_col, m_row, tostring(round(array.get(month_pnl, mi) * 100)) + " (" + tostring(round(array.get(month_bh, mi) * 100)) +")", bgcolor = m_color)

More