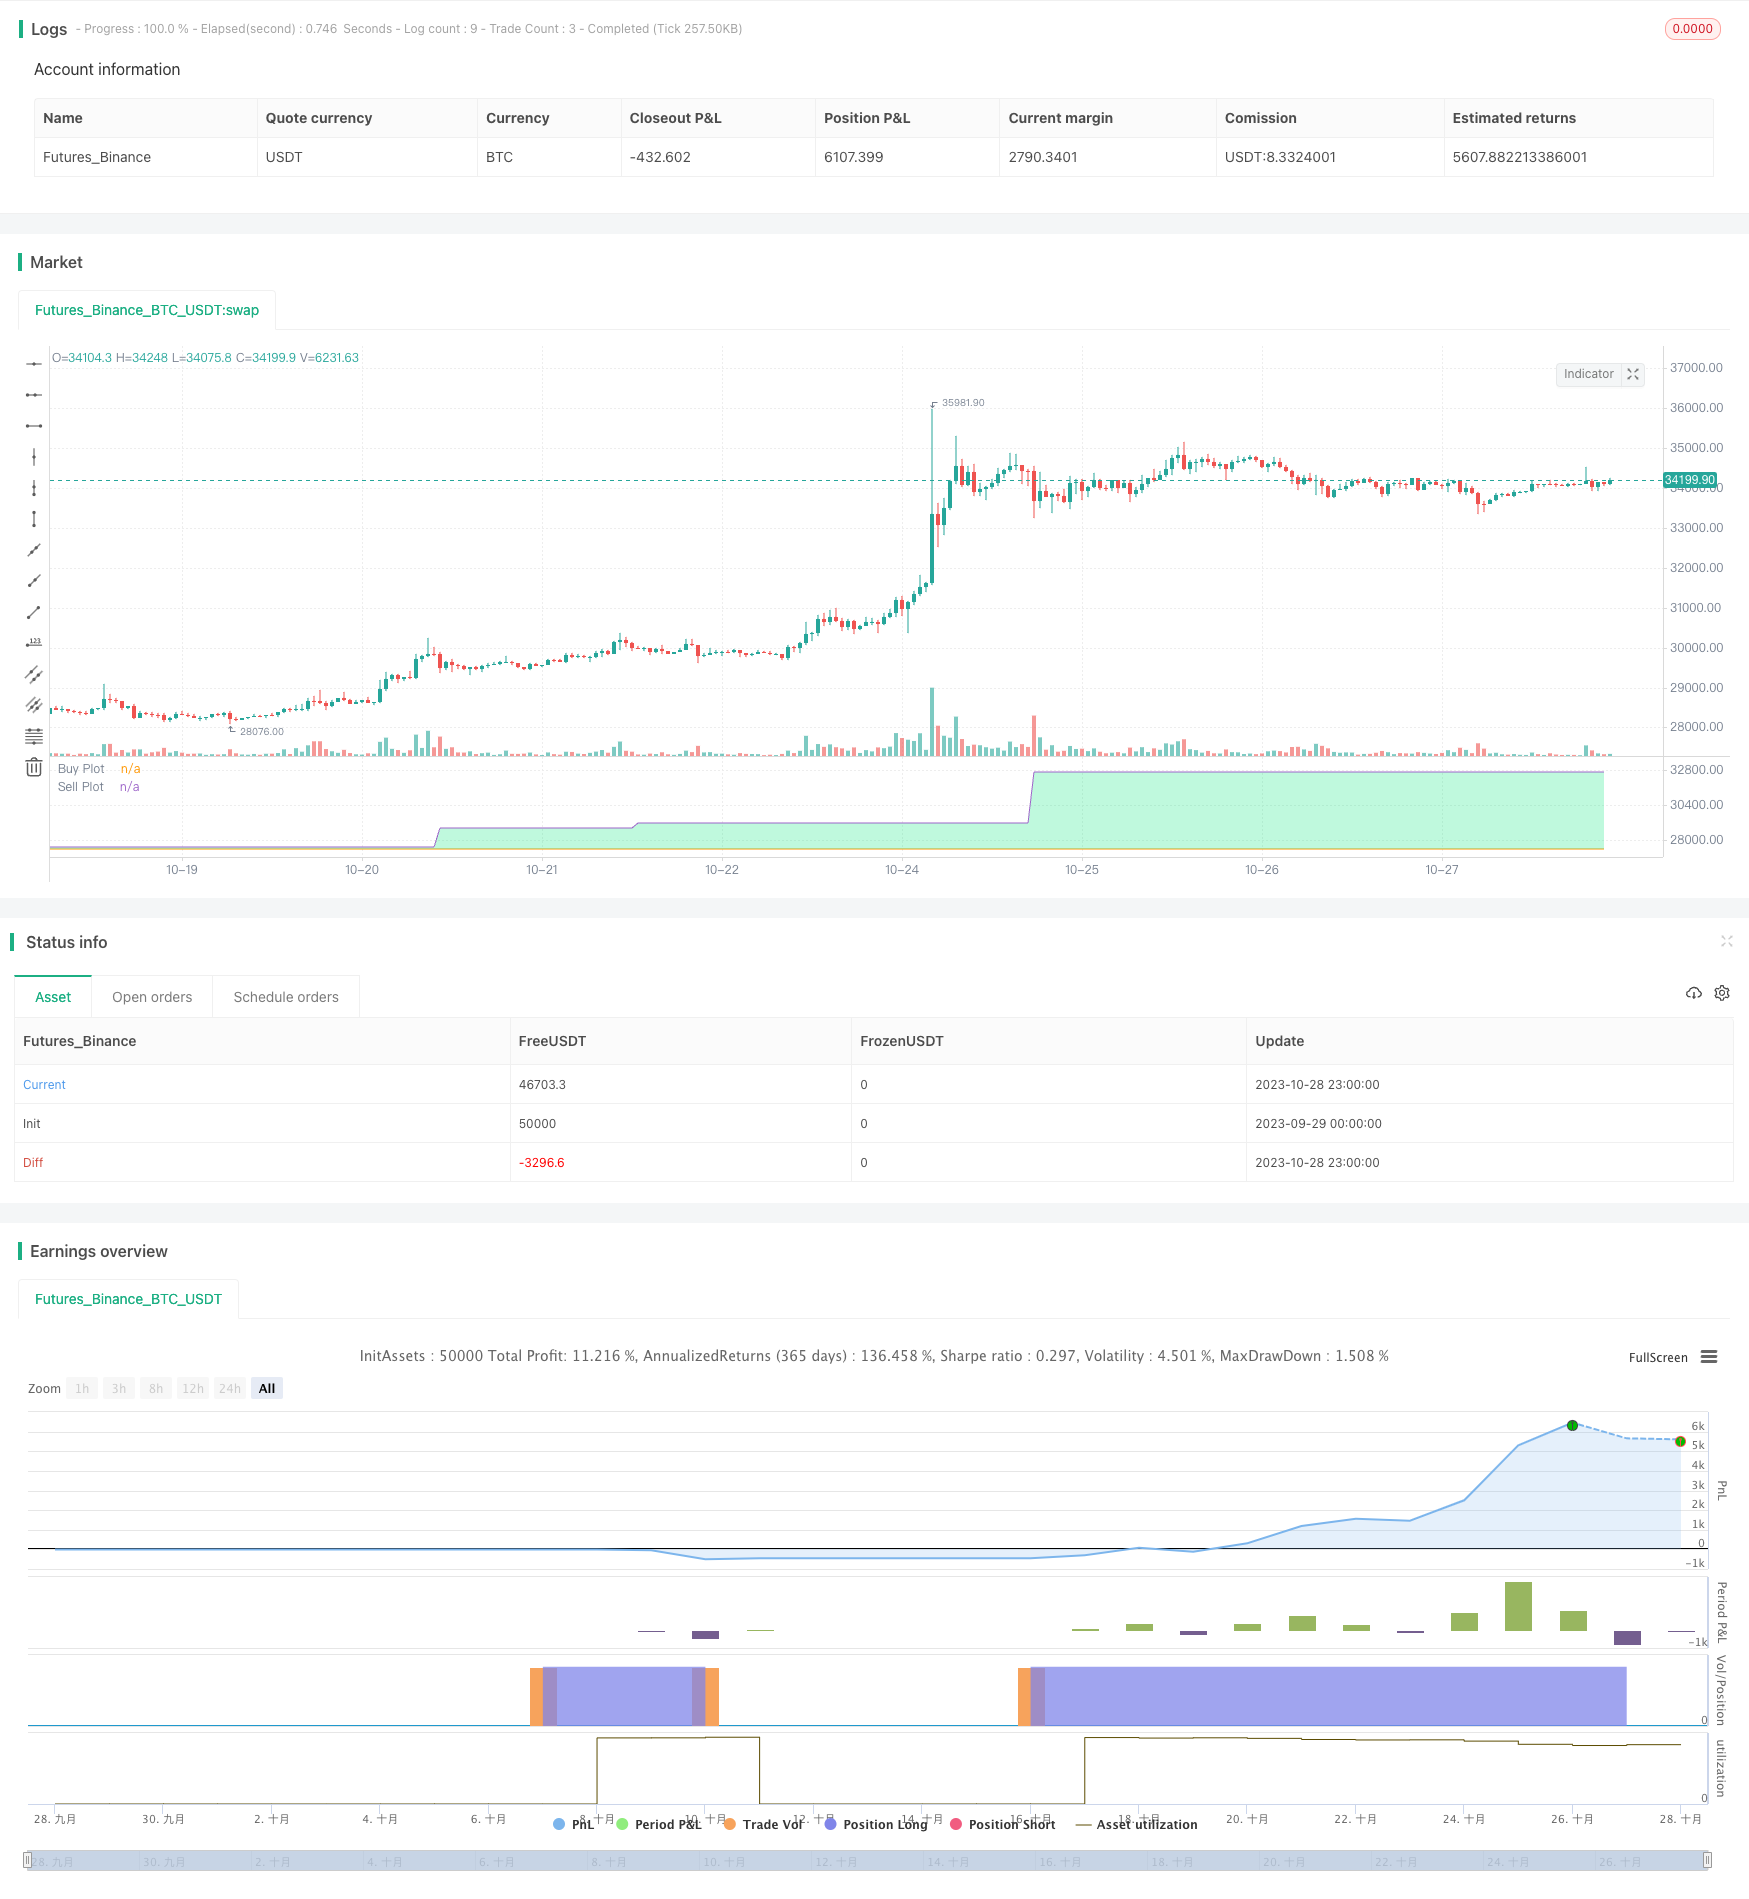
概述
该策略是一种拟似Grid Bot的策略,主要用于算法交易。它采用一个基于交易量计算的动态、非等间距的Grid网格,并且只在RSI满足特定条件时才更新网格。它也具有突破交易的特性,与普通Grid Bot不同(典型的Grid Bot在达到更高grid线时卖出,而本策略在特定条件下跌破更低grid线时卖出)。该策略也在收盘时平仓所有的金字塔式订单。
简而言之,该策略在每次RSI穿越过买入/卖出信号线时,将网格更新为你给定的数据源(设置中的”src”)的基于交易量计算的最高价/最低价。它会根据这个区间生成5条等间距的线,并用当前的数据源判断最接近的数据源的是哪条线。如果数据源突破当前线正上方的线,则发出买入信号;如果数据源跌破当前线正下方的线,则发出卖出信号。
你可以在设置中配置是否做空、数据源、RSI周期长度以及超买超卖线。
策略原理
该策略的核心逻辑是:
使用RSI指标判断趋势反转点,以RSI线穿越设置的超买区或超卖区作为确认信号。
在RSI确认信号出现时,记录一定周期内的最高价和最低价,设置为网格上下限。
根据上下限均分为5条网格线,实时判断价格接近哪条网格线。
当价格突破网格线上方线时,做多入场;当价格跌破网格线下方线时,平仓做空入场。
使用突破网格的方式,而不是触碰网格的普通Grid Bot方式,可以更好抓取趋势突破。
在交易日收盘时,平仓全部金字塔订单,防止隔夜风险。
该策略主要由以下部分组成:
输入参数设置:包括数据源、RSI参数、做多做空选择等。
RSI指标计算:计算RSI指标并判断其是否出现穿越信号。
动态网格设置:在RSI信号发生时记录价格范围并计算网格线。
信号判断:检测价格是否突破网格上下线,判断做多做空信号。
订单管理:发出做多做空信号并在收盘前平仓金字塔订单。
绘图界面:显示网格线、做多做空区域等。
通过动态更新网格,结合RSI指标的趋势判断和突破信号,使该策略能够有效跟踪趋势,在反转时及时调整方向。收盘前平仓可有效控制隔夜风险。
优势分析
该策略具有以下主要优势:
动态网格可以根据趋势自适应调整,而不是固定不变的网格,更具弹性。
只在RSI确认趋势反转时调整网格,可以过滤掉部分噪音信号。
使用突破信号而不是仅触碰信号,可以更准确抓取趋势转折点。
收盘前全部平仓,可以规避隔夜大幅波动的风险,保护利润。
RSI指标可以较好地判断超买超卖情况,与动态网格结合效果好。
采用突破模式而非回调模式,可以在趋势初期获得较好入场机会。
调整网格间距和交易量比例可以灵活调整策略的风险收益特征。
图形界面直观显示网格分布和做多做空区域。
可选择是否开启做空,满足不同交易者的需求。
规则简单清晰,易于理解实现,适合算法交易。
上述优势使该策略可以自动跟踪趋势,同时控制风险,适合量化交易实盘应用。
风险分析
该策略也存在一些潜在风险需要注意:
大幅震荡趋势中,可能出现止损风险。可适当放宽止损范围,或在震荡期间暂停策略。
夜间可能出现隔夜大幅跳空,导致开盘头寸较大。可考虑降低头寸比例规避该风险。
参数设置不当可能导致交易频繁或信号产生误差。应谨慎测试优化参数。
交易费用较高时,网格交易利润可能被反复吃掉。应适当调整交易数量或选择费率更低的交易所。
突破信号可能略晚于趋势反转点出现,需要合理设置突破幅度。
在股市平稳上涨阶段,该策略可能表现不佳。可考虑与其他指标组合使用。
需要足够的资金支持较大的头寸和金字塔仓位,否则效果不佳。应根据资金量调整仓位。
对策:
优化参数,降低交易频率,防止过度交易。
结合趋势指标,避开震荡期交易。
调整仓位,降低单笔交易比例,控制风险。
测试不同的突破幅度参数,平衡及时性和稳定性。
可以考虑与其他指标组合,利用更多市场信息。
增加资金量,扩大仓位规模,提高盈利空间。
通过参数优化、风险管理、与其他策略组合等方法,可以在一定程度上减少该策略的风险,使其可以稳定运作。
优化方向
该策略可以在以下方面进一步优化:
优化RSI参数,测试不同的RSI周期长度,寻找最佳参数组合。
测试不同的网格间距设置,找到最佳收益风险比的网格。
尝试结合其他指标过滤信号,例如MACD、KD等,提高准确率。
开发自适应止损策略,根据市场波动程度来动态调整止损幅度。
增加开仓条件,仅在趋势足够明确时开仓,避免被套。
进行回测优化,测试更长时间段的数据,评估参数稳定性。
尝试基于机器学习的动态参数优化,让策略自适应各市场环境。
探索结合Options的策略,利用Options对冲仓位风险。
根据最近行情特点,调整参数优化策略,保持策略有效性。
开发图形化策略优化平台,辅助快速优化测试。
通过自动化的参数优化、策略组合以及引入更多市场信息等方式,该策略可以取得更好的稳定性和收益率,成为真正可靠的量化交易策略。
总结
整体来看,该RSI矩形网格策略利用RSI指标判断趋势反转确认信号,设置价格范围动态网格,在突破网格线时交易,在日内完全平仓,形成一个灵活的趋势跟踪算法交易策略。相比固定网格策略,它可以更好地自适应市场变化。
该策略具有一定的优势,包括结合RSI指标判断趋势、动态网格自适应、突破模式交易及日内完全平仓等。这使其可以有效跟踪趋势同时控制风险。但该策略也存在一些潜在风险需要注意,比如震荡趋势下的止损风险、隔夜跳空风险等。可以通过参数优化、与其他信号组合以及风险管理手段来减少这些风险。
该策略还有许多优化的方向,通过引入更多指标、机器学习优化参数以及图形化回测平台等手段,可以将其优化成一个更稳定、收益更高的算法交易策略。总体来说,该策略为量化交易提供了一个可靠、易于操作的趋势跟踪算法框架。
/*backtest
start: 2023-09-29 00:00:00
end: 2023-10-29 00:00:00
period: 1h
basePeriod: 15m
exchanges: [{"eid":"Futures_Binance","currency":"BTC_USDT"}]
*/

// This source code is subject to the terms of the Mozilla Public License 2.0 at https://mozilla.org/MPL/2.0/
// © wbburgin

//@version=5
// strategy("RSI Box Strategy (pseudo-Grid Bot)", overlay=true, initial_capital = 10000,
//  default_qty_type = strategy.percent_of_equity, default_qty_value = 1, pyramiding = 33, commission_value=0.10)

src = input.source(close,"Source")
rsiLength = input.int(14,"RSI Length")
oblvl = input.int(70,"Overbought Level")
oslvl = input.int(30,"Oversold Level")
useShorts = input.bool(false,"Use Shorts",inline="B")
showGrid = input.bool(false,"Show Grid",inline="B")

rsi = ta.rsi(src,rsiLength)

rsi_crossdn = ta.crossunder(rsi,oblvl)
rsi_crossup = ta.crossover(rsi,oslvl)

highest = ta.vwma(ta.highest(src,rsiLength),rsiLength)
lowest = ta.vwma(ta.lowest(src,rsiLength), rsiLength)

gridTop = ta.valuewhen(rsi_crossdn,highest,0)
gridBottom = ta.valuewhen(rsi_crossup,lowest,0)
gridMiddle = math.avg(gridTop,gridBottom)
gridMidTop = math.avg(gridMiddle,gridTop)
gridMidBottom = math.avg(gridMiddle,gridBottom)

diff1 = math.abs(src - gridTop)
diff2 = math.abs(src - gridBottom)
diff3 = math.abs(src - gridMiddle)
diff4 = math.abs(src - gridMidTop)
diff5 = math.abs(src - gridMidBottom)

minDiff = math.min(diff1, diff2, diff3, diff4, diff5)

// Determine which line is the closest
float closestLine = na
if minDiff == diff1
    closestLine := gridTop
else if minDiff == diff2
    closestLine := gridBottom
else if minDiff == diff3
    closestLine := gridMiddle
else if minDiff == diff4
    closestLine := gridMidTop
else if minDiff == diff5
    closestLine := gridMidBottom

buyCrosses = ta.crossover(src,gridTop) or ta.crossover(src,gridBottom) or ta.crossover(src,gridMiddle) or ta.crossover(src,gridMidTop) or ta.crossover(src,gridMidBottom)
sellCrosses= ta.crossunder(src,gridTop) or ta.crossunder(src,gridBottom) or ta.crossunder(src,gridMiddle) or ta.crossunder(src,gridMidTop) or ta.crossunder(src,gridMidBottom)

condition_bull = buyCrosses
condition_bear = sellCrosses

var float bull_status_line = na
var float bear_status_line = na
var float bull_buy_line = na
var float bear_sell_line = na

if condition_bull
    bull_status_line := closestLine
if condition_bear
    bear_status_line := closestLine

if bull_status_line == gridBottom
    bull_buy_line := gridMidBottom
if bull_status_line == gridMidBottom
    bull_buy_line := gridMiddle
if bull_status_line == gridMiddle
    bull_buy_line := gridMidTop
if bull_status_line == gridMidTop
    bull_buy_line := gridTop

if bear_status_line == gridTop
    bear_sell_line := gridMidTop
if bear_status_line == gridMidTop
    bear_sell_line := gridMiddle
if bear_status_line == gridMiddle
    bear_sell_line := gridMidBottom
if bear_status_line == gridMidBottom
    bear_sell_line := gridBottom

l = ta.crossover(src,bull_buy_line)
s = ta.crossunder(src,bear_sell_line)

if l
    strategy.entry("Long",strategy.long)
if s
    strategy.close("Long")
    if useShorts
        strategy.entry("Short",strategy.short)

// Plotting
in_buy = ta.barssince(l) < ta.barssince(s)
u=plot(bull_buy_line,color=na,title="Buy Plot")
d=plot(bear_sell_line,color=na,title="Sell Plot")

plot(not showGrid?na:gridBottom,color=color.new(color.white,75),title="Grid Line -2")
plot(not showGrid?na:gridMidBottom,color=color.new(color.white,75),title="Grid Line -1")
plot(not showGrid?na:gridMiddle,color=color.new(color.white,75),title="Grid Line 0")
plot(not showGrid?na:gridMidTop,color=color.new(color.white,75),title="Grid Line 1")
plot(not showGrid?na:gridTop,color=color.new(color.white,75),title="Grid Line 2")


fill(u,d,color=in_buy ? color.new(color.lime,75) : color.new(color.red,75))