Momentum Trend Following Strategy

Overview
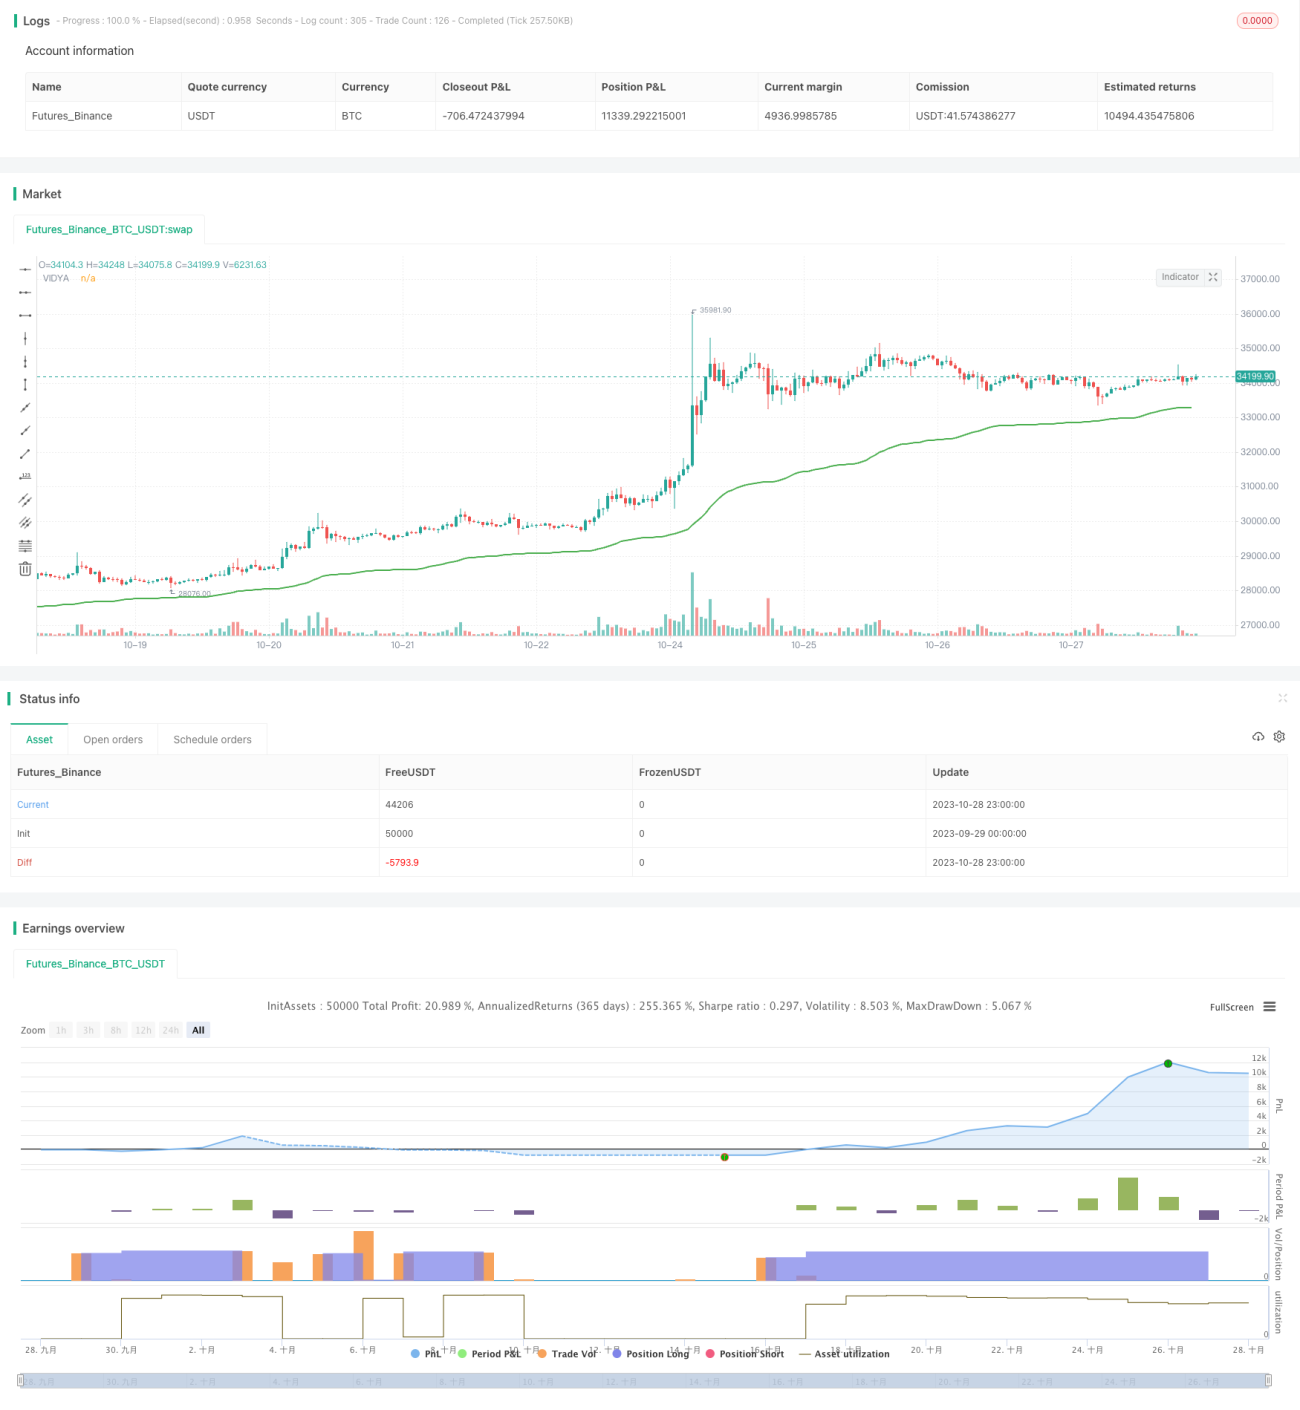
This strategy uses the VIDYA (Variable Index Dynamic Average) indicator to identify the trend direction in cryptocurrency markets and trades based on the trend. It is a quantitative technical trading strategy.
Strategy Logic
The strategy first calculates the VIDYA indicator. The VIDYA indicator is based on price momentum and can respond to trend changes faster. Specifically, it combines the Chande Momentum Oscillator (CMO) and Simple Moving Average (SMA). CMO measures the difference between upward and downward momentum to gauge trend strength. SMA smoothes price data. VIDYA dynamically adjusts the weighting of SMA based on CMO values, giving more weight to CMO early in trend changes and more weight to SMA once the trend is established. Thus, VIDYA can quickly respond to trend changes while also maintaining a smooth tracking of the trend.
After calculating VIDYA, the strategy judges the trend direction based on the curve of VIDYA. It goes long when VIDYA rises and closes position when VIDYA falls.
Advantage Analysis
-
VIDYA responds swiftly and can capture trend changes early compared to traditional indicators like SMA.
-
Combining trend strength and direction, it can effectively distinguish strong and weak trends and avoid false trends in ranging markets.
-
Relying solely on VIDYA makes the strategy simple. No conflicting or misleading signals from multiple indicators.
-
Longer VIDYA settings allow tracking long-term trends and capturing the main trend direction.
-
Good backtest results with positive expected returns.
Risk Analysis
-
VIDYA may lag in response to sudden market events and miss short-term trading opportunities.
-
Long VIDYA settings make it less sensitive to short-term trend changes and can lead to larger drawdowns.
-
Pure trend following performs poorly in choppy markets. Additional filters can improve performance.
-
Limited backtest data cannot fully verify robustness. Parameters need iterative optimization and testing in live trading.
-
High volatility in crypto markets. Position sizing and stop loss should be carefully controlled for strict risk management.
Optimization Directions
-
Test adding volume or volatility indicators to improve sensitivity to trend changes.
-
Try combining VIDYA with other trend indicators for ensemble effect.
-
Optimize stop loss strategy to exit early when trend reverses.
-
Optimize position sizing dynamically based on market conditions.
-
Test robustness across different cryptocurrencies and timeframes.
Conclusion
Overall this is a quantitative trend following strategy. It uses the VIDYA indicator to determine trend direction, capturing crypto trends simply and effectively. But it also has some limitations that require further optimizations in stop loss, position sizing etc. to make the strategy more robust and practically viable. In general, it provides a basic framework and approach for building crypto trend strategies, but prudent assessments are still needed for real-world applications.
/*backtest
start: 2023-09-29 00:00:00
end: 2023-10-29 00:00:00
period: 1h
basePeriod: 15m
exchanges: [{"eid":"Futures_Binance","currency":"BTC_USDT"}]
*/

// This source code is subject to the terms of the Mozilla Public License 2.0 at https://mozilla.org/MPL/2.0/
// @version=5
// Author = TradeAutomation
- 1