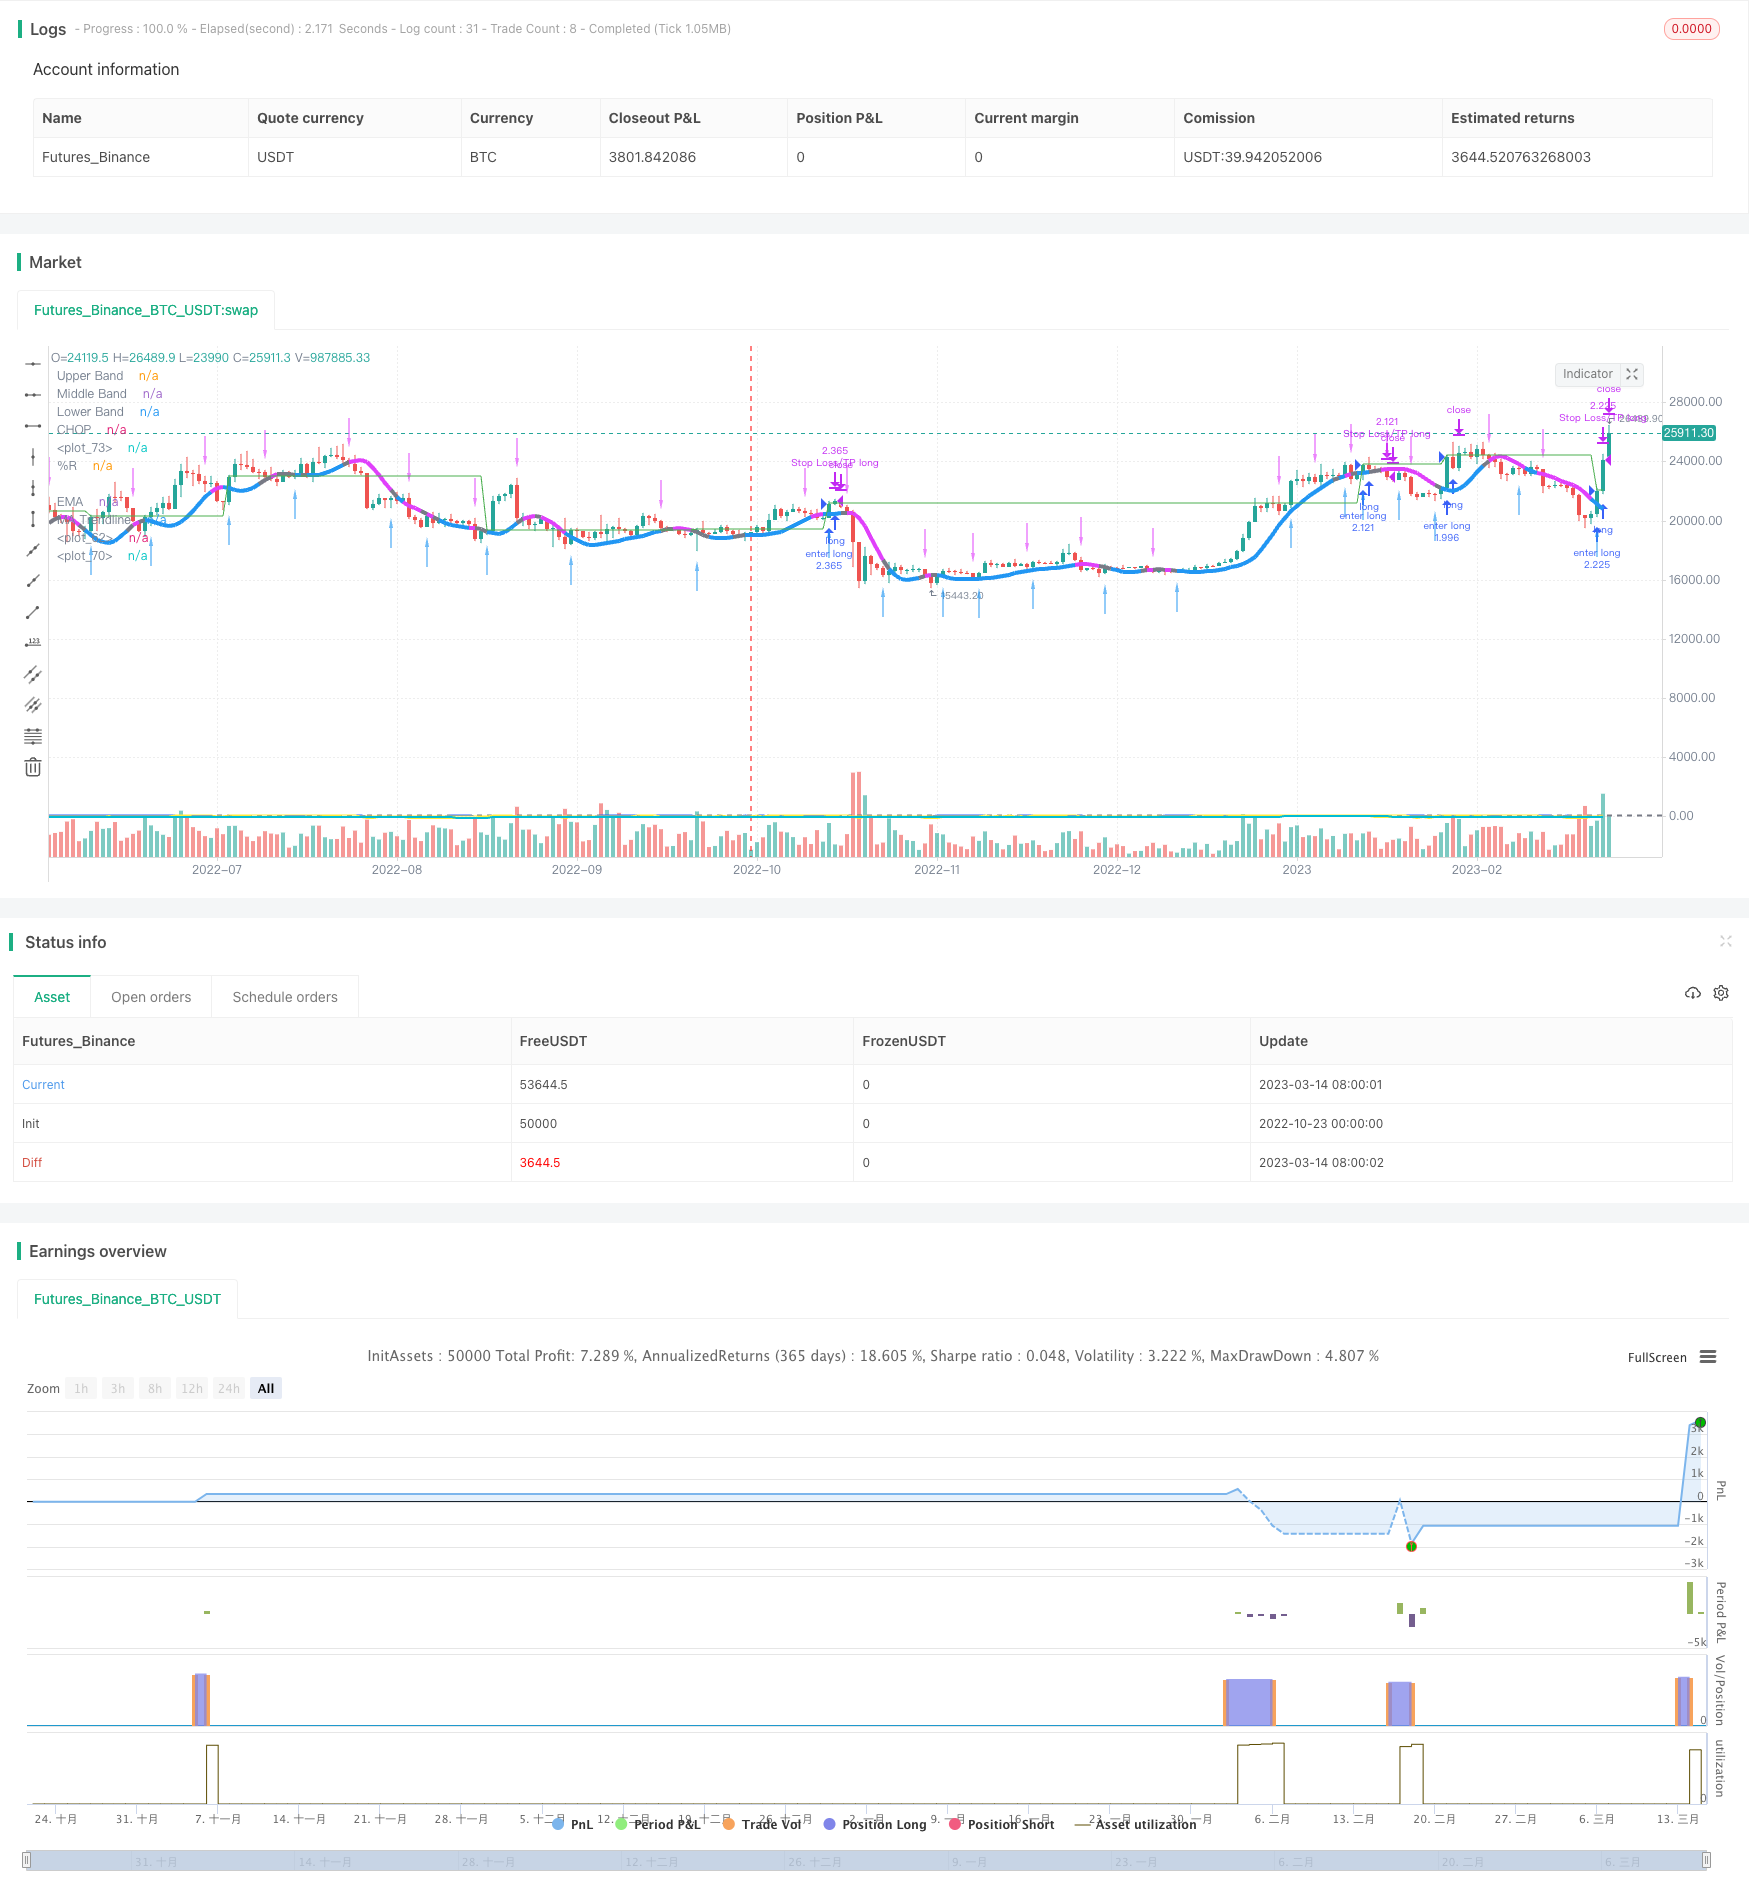
本策略通过追踪均线的突破,在震荡市实现持续盈利。
策略原理
该策略主要基于均线的突破原理进行建仓,使用 MA 聚合多重均线,形成主均线。当价格突破主均线时产生交易信号。
具体来说,策略采用 60 周期的 WMA 双滑动平均线作为主均线。同时,计算价格的真实波动范围,并绘制上下通道。价格突破上轨时看涨,突破下轨时看跌。
在突破基础上,策略还引入 RSI 指标和 EMA 指标进行辅助判断,要求 RSI>50 且价格高于 EMA 时做多,RSI<50 且价格低于 EMA 时做空,从而避免假突破。
此外,策略利用三重均线的强弱态势判断结束仓位。当三重均线formations为弱势时(-1),选择退出点为反向突破通道。
策略优势
- 使用 MA 多重均线,能够有效平滑价格变动,识别趋势方向
- 基于通道突破交易,可在震荡行情中获取较大利润
- 结合 RSI 和 EMA 进行辅助判断,可过滤假突破信号
- 利用三重均线状态判断适当退出点位,可避免衰竭行情
策略风险
- 大幅震荡行情中,MA 主均线可能产生较多假突破
- 三重均线判断的退出时机可能不精确
- RSI 参数设置不当可能导致交易频率过高
可通过优化 MA 周期参数,调整三重均线设置,谨慎使用 RSI 参数等方法降低风险。
策略优化方向
- 优化 MA 周期参数,寻找更合适的主均线周期
- 尝试不同的辅助指标替换 RSI,如 KDJ、MACD 等
- 调整三重均线参数,寻找更准确的反转时机
- 添加止损策略,控制单笔交易风险
总结
本策略整体来说是一个非常适合震荡行情的突破策略。核心思路是基于 MA 突破建仓,辅以趋势指标过滤,在震荡行情中持续盈利。同时结合三重均线判断反转时机提前退出。该策略优化空间较大,可从调整参数、改进入场退出等方面进行优化,在震荡行情中可能获得较好的效果。
策略源码
/*backtest
start: 2022-10-23 00:00:00
end: 2023-03-15 00:00:00
period: 1d
basePeriod: 1h
exchanges: [{"eid":"Futures_Binance","currency":"BTC_USDT"}]
*/


//@version=5

//exapple bot
strategy('RIPO BOT', shorttitle='RIPO BOT', overlay=true, process_orders_on_close=true, calc_on_order_fills=false, default_qty_type=strategy.percent_of_equity, default_qty_value=100)
sl_inp = input(0.1, title='Stop Loss %') / 100
tp_inp = input(0.33, title='Take Profit %') / 100

length = input(defval=21)
upper = ta.highest(length)
lower = ta.lowest(length)

lengthChop = input.int(14, minval=1)
ci = 100 * math.log10(math.sum(ta.atr(1), lengthChop) / (ta.highest(lengthChop) - ta.lowest(lengthChop))) / math.log10(lengthChop)
offset = input.int(0, "Offset",  minval = -500, maxval = 500)
plot(ci, "CHOP", color=#2962FF, offset = offset)
band1 = hline(61.8, "Upper Band", color=#787B86, linestyle=hline.style_dashed)
hline(50, "Middle Band", color=color.new(#787B86, 50))
band0 = hline(38.2, "Lower Band", color=#787B86, linestyle=hline.style_dashed)
fill(band1, band0, color = color.rgb(33, 150, 243, 90), title = "Background")

rsi = ta.rsi(close, 14)

var float entry_price = na

output = 100 * (close - upper) / (upper - lower)
ema = ta.ema(output, input(defval=13, title='EMA'))

ma(src, len) =>
    ta.wma(2 * ta.wma(src, len / 2) - ta.wma(src, len), math.round(math.sqrt(len)))
BBMC = ma(close, 60)
rangema = ta.ema(ta.tr, 60)
upperk = BBMC + rangema * 0.2
lowerk = BBMC - rangema * 0.2
color_bar = close > upperk ? color.blue : close < lowerk ? color.fuchsia : color.gray

ExitHigh = ma(high, 15)
ExitLow = ma(low, 15)
Hlv3 = int(na)
Hlv3 := close > ExitHigh ? 1 : close < ExitLow ? -1 : Hlv3[1]
sslExit = Hlv3 < 0 ? ExitHigh : ExitLow
base_cross_Long = ta.crossover(close, sslExit)
base_cross_Short = ta.crossover(sslExit, close)
codiff = base_cross_Long ? 1 : base_cross_Short ? -1 : na
entry_long = false

entry_short = false


if ta.crossover(close, BBMC) and output > ema
    entry_long := true

if ta.crossunder(close, BBMC) and output < ema
    entry_short := true

if entry_long and strategy.position_size == 0
    entry_price := close
    strategy.entry('enter long', strategy.long, comment='ENTER-LONG_BYBIT_MATICUSDT_BOT-NAME_1M_85915e4dc80fb663')
if strategy.position_size > 0
    strategy.exit('Stop Loss/TP long', 'enter long', limit=entry_price * (1 + tp_inp), stop = color_bar == color.fuchsia ? BBMC : na, comment='EXIT-LONG_BYBIT_MATICUSDT_BOT-NAME_1M_85915e4dc80fb663')
plot(entry_price * (1 + tp_inp), color=color.new(color.green, 0))


//if entry_short and strategy.position_size == 0
    //entry_price := close
    //strategy.entry('enter short', strategy.short, comment='ENTER-SHORT_BYBIT_MATICUSDT_BOT-NAME_1M_85915e4dc80fb663')
if strategy.position_size < 0
    strategy.exit('Stop Loss/TP short', 'enter short', limit=entry_price * (1 - tp_inp), stop = color_bar == color.blue ? BBMC : na, comment='EXIT-SHORT_BYBIT_MATICUSDT_BOT-NAME_1M_85915e4dc80fb663')
plot(entry_price * (1 + tp_inp), color=color.new(color.green, 0))
// plot(entry_price * (1 - sl_inp), color=color.new(color.red, 0))

plot(rsi, color=color.yellow)

plot(output, title='%R', color=color.new(color.yellow, 0), linewidth=2)
plot(ema, title='EMA', color=color.new(color.aqua, 0), linewidth=2)

plotarrow(codiff, colorup=color.new(color.blue, 35), colordown=color.new(color.fuchsia, 35), title='Exit Arrows', maxheight=20, offset=0)
plot(BBMC, color=color_bar, linewidth=4, title='MA Trendline')