Strong Trend Breakout Strategy

Overview
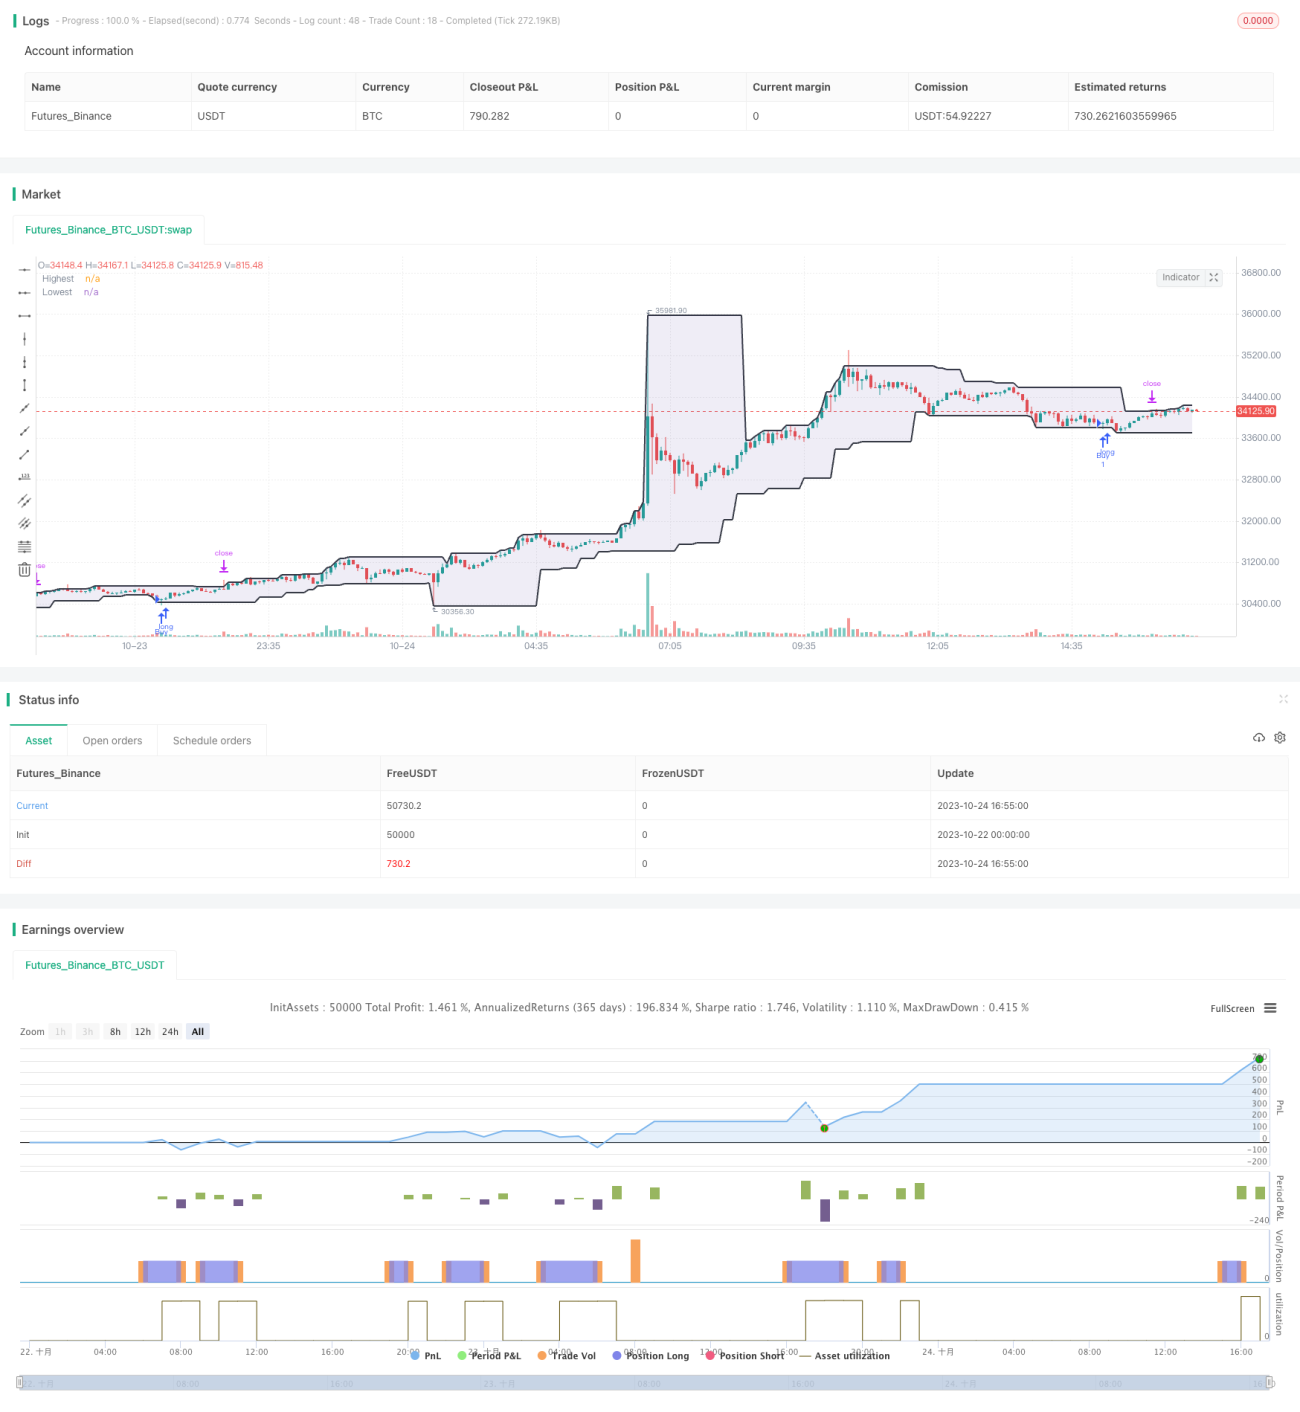
This strategy calculates the highest high and lowest low over a certain period to form upper and lower bands. It goes long when the price breaks above the upper band and closes the position when the price breaks below the lower band. The strategy aims to capture the strong trending phases by trading trend breakouts.
Strategy Logic
The strategy first calculates the highest high and lowest low over the past 20 bars to form the upper and lower bands. When the closing price of the current bar is above the upper band, it goes long. When the price breaks below the lower band, it closes the position.
Specifically, the strategy uses the highest and lowest functions to calculate the highest high and lowest low over the past 20 bars, forming a range. It then checks if the closing price of the current bar is above the upper band. If yes, it goes long. If the price breaks below the lower band, it exits the position.
The strategy relies on trend breakouts to determine entry signals. It is a trend following system that only goes long and does not short. It is suitable for strongly trending instruments.
Advantage Analysis
The strategy has the following advantages:
-
The strategy logic is simple and easy to understand.
-
It captures strong trending phases by trading trend breakouts.
-
It uses a moving stop loss to control risks and limit losses.
-
It only goes long and does not short, suitable for trending markets.
-
Customizable parameters for period length and stop loss.
Risk Analysis
The strategy also has the following risks:
-
It cannot identify trend reversals and may result in buying at the top.
-
Stop loss can be easily triggered by large instant price gaps.
-
It may generate multiple small losses when the trend changes.
-
It only goes long and cannot profit from downtrends.
-
Improper parameter settings may cause oversensitivity or sluggishness.
Optimization Directions
The strategy can be improved in the following aspects:
-
Add trend identification indicators to avoid trading against reversals. E.g. MACD.
-
Optimize the stop loss strategy for better risk control. E.g. trailing stop loss.
-
Add short position logic to profit from downtrends.
-
Backtest and optimize parameters to find the best combination.
-
Add dynamic parameter optimization based on market conditions.
-
Incorporate analysis across multiple timeframes to avoid misleading by a single timeframe.
Summary
The strategy has clear and simple logic, capturing strong trends through breakouts. It controls risk via stop loss. However, it also has some weaknesses like inaccurate trend judgment and stop loss being triggered. We can improve it by enhancing trend identification, stop loss strategy, short positions, and parameter optimization to make the strategy more robust.
- 1