Trend Trading Strategy Based on Moving Average

Author: ChaoZhang, Date: 2023-10-30 15:53:25
Tags:

img

Overview

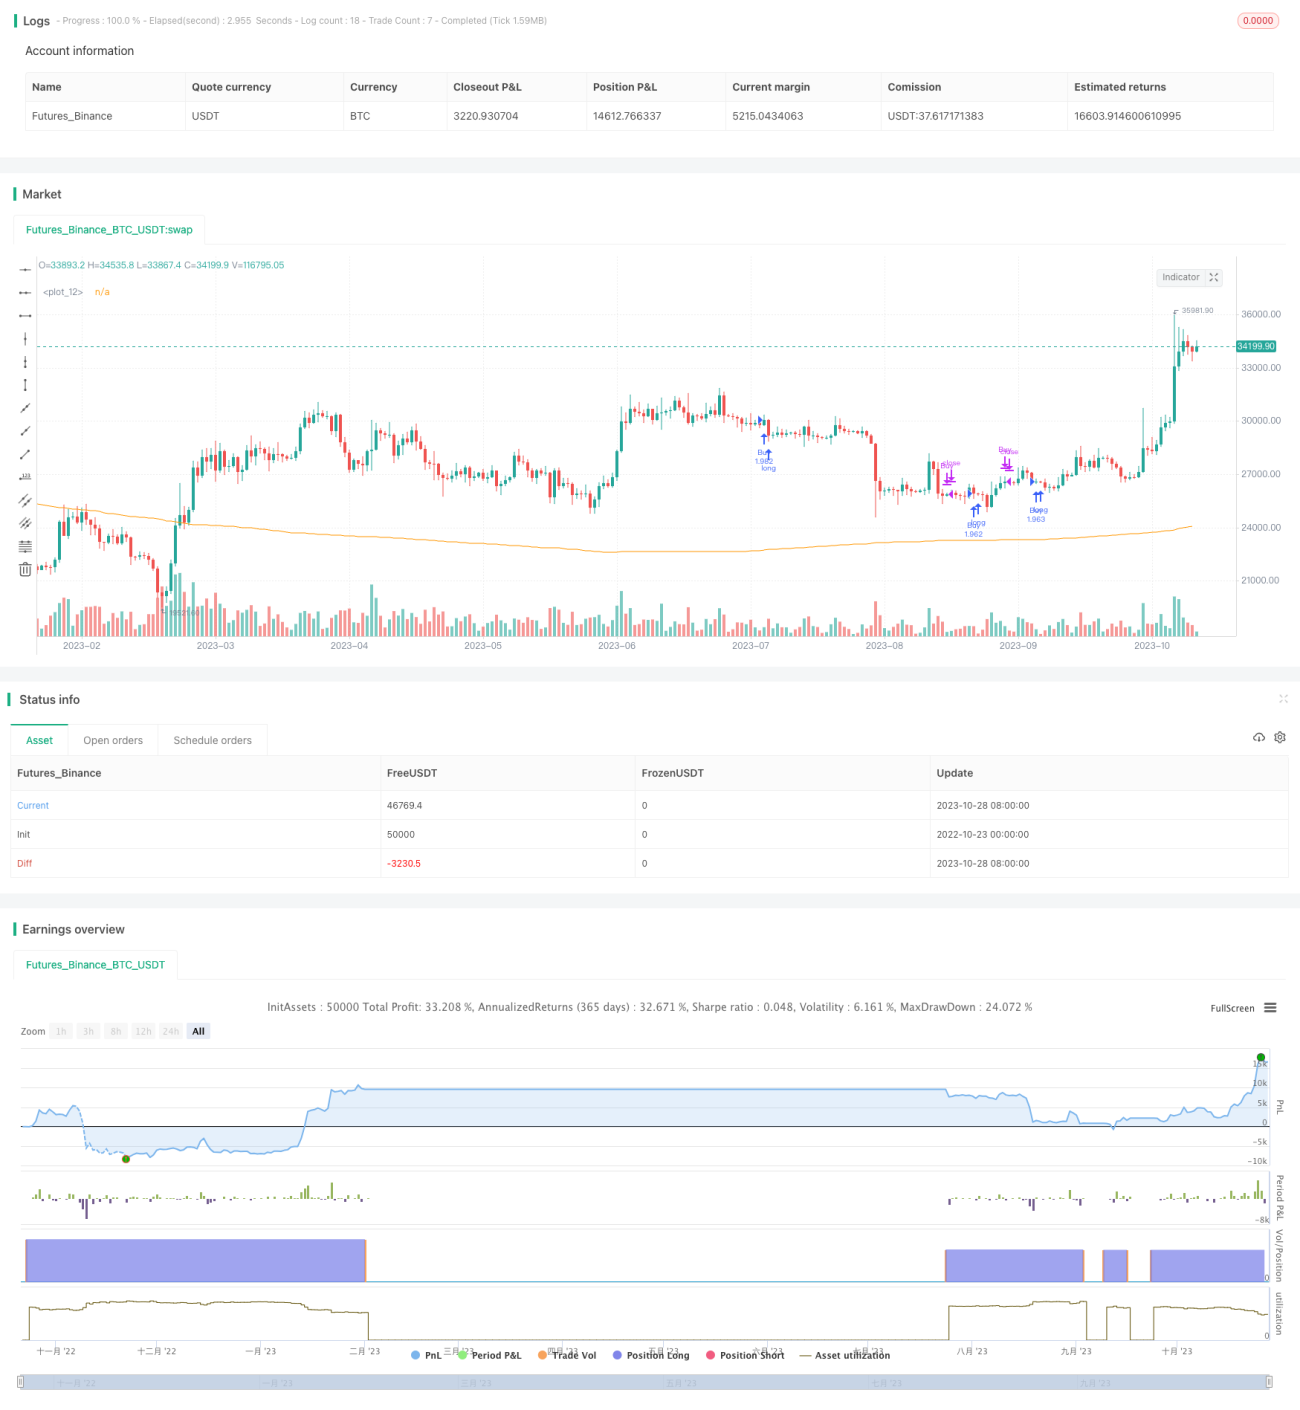
This strategy uses a moving average system to determine the current trend direction and makes long or short positions according to the trend. When the moving average goes up, the confidence in long is higher, so go long. When the moving average goes down, the confidence in short is higher, so go short. This strategy mainly uses the moving average system to determine the market trend direction, belonging to the trend following strategy.

Strategy Logic

  1. Calculate the weighted moving average vwma as the moving average indicator for a certain period (default 400 periods).

  2. Determine if the moving average vwma is rising, if rising set the long signal uptrend; if falling set the short signal downtrend.

  3. When uptrend is true, go long; when downtrend is true, close long and go short.

  4. Calculate the strategy return bar_pnl and buy & hold return bar_bh for each bar.

  5. According to the quarterly and yearly timestamps, calculate the quarterly strategy return quarter_pnl, yearly return year_pnl and the corresponding buy & hold returns quarter_bh, year_bh.

  6. Show the quarterly strategy return vs buy & hold return in a table.

Advantage Analysis

The main advantages of this strategy are:

  1. Simple to operate. Determine the market trend by moving average, easy to understand.

  2. Good at controlling drawdown. Following the trend reduces losses in non-trending markets.

  3. Few tunable parameters. Mainly adjust the moving average period, easy to test and optimize.

  4. Intuitive return table to show the results clearly.

  5. Add buy & hold return in the table for comparison, shows the excess return.

  6. Flexible table position, easy to integrate with other strategies.

Risk Analysis

There are also some risks:

  1. Underperformance in long-lasting bull market compared to buy & hold. Can optimize the moving average period.

  2. High whipsaw risk in range-bound market. Can add filter conditions like breaking previous high to reduce transactions.

  3. Moving average has poor curve fitting ability, may miss trend turning points. Can test different types of moving averages.

  4. No stop loss mechanism, risks of huge drawdown. Can set dynamic stop loss or position sizing.

  5. For the table, can add risk metrics like sharpe ratio, max drawdown.

Optimization Directions

The strategy can be optimized in the following aspects:

  1. Optimize the moving average parameters, adjust period based on market regimes.

  2. Add filters like breaking previous high to reduce whipsaws.

  3. Try different types of moving averages, like WMA, DEMA etc.

  4. Add stop loss mechanisms, like dynamic stops or position sizing.

  5. Enrich table contents, add metrics like sharpe ratio, max drawdown.

  6. Combine with other indicators like MACD, Bollinger Bands to determine trends.

  7. Optimize position sizing, adjust positions dynamically based on market conditions.

  8. Test on different products, find the best application scope.

Conclusion

The moving average trading strategy is relatively simple and straightforward. It follows the trend by determining trend using moving average, with good drawdown control, suitable for trend following traders. There is still large room for optimization, like the moving average system, stop loss mechanism, position sizing etc. to make it adaptable to complex market environments. The table design compares the strategy return to buy & hold, showing the excess returns intuitively. The framework and table design of this strategy can provide some good reference for quantitative traders.


/*backtest
start: 2022-10-23 00:00:00
end: 2023-10-29 00:00:00
period: 1d
basePeriod: 1h
exchanges: [{"eid":"Futures_Binance","currency":"BTC_USDT"}]
*/

// This source code is subject to the terms of the Mozilla Public License 2.0 at https://mozilla.org/MPL/2.0/
// © Dannnnnnny

//@version=4
strategy(title="Quarterly Returns in Strategies vs Buy & Hold", initial_capital= 1000, overlay=true,default_qty_type = strategy.percent_of_equity, default_qty_value = 100, commission_type = strategy.commission.percent, commission_value = 0.1)
maLength= input(400)

wma= vwma(hl2,maLength)
uptrend= rising(wma, 5)
downtrend= falling(wma,5)

plot(wma)

if uptrend
    strategy.entry("Buy", strategy.long)
else
    strategy.close("Buy")//

///////////////////
// QUARTERLY TABLE //
enableQuarterlyTable = input(title="Enable Quarterly Return table", type=input.bool, defval=false)
enableCompareWithMarket = input(title="Compare with Market Benchmark", type=input.bool, defval=false)
table_position = input(title="Table Position", type=input.string, defval='bottom_right', options=['bottom_right','bottom_left','top_right', 'top_left'])
precision = 2
new_quarter = ceil(month(time)/3)  != ceil(month(time[1])/3)
new_year  = year(time)  != year(time[1])

eq = strategy.equity

bar_pnl = eq / eq[1] - 1
bar_bh = (close-close[1])/close[1]

cur_quarter_pnl = 0.0
cur_year_pnl  = 0.0
cur_quarter_bh = 0.0
cur_year_bh  = 0.0

// Current Quarterly P&L
cur_quarter_pnl := new_quarter ? 0.0 : 
                 (1 + cur_quarter_pnl[1]) * (1 + bar_pnl) - 1 
cur_quarter_bh := new_quarter ? 0.0 : 
                 (1 + cur_quarter_bh[1]) * (1 + bar_bh) - 1

// Current Yearly P&L
cur_year_pnl := new_year ? 0.0 : 
                 (1 + cur_year_pnl[1]) * (1 + bar_pnl) - 1
cur_year_bh := new_year ? 0.0 : 
                 (1 + cur_year_bh[1]) * (1 + bar_bh) - 1

// Arrays to store Yearly and Quarterly P&Ls
var quarter_pnl  = array.new_float(0)
var quarter_time = array.new_int(0)
var quarter_bh  = array.new_float(0)

var year_pnl  = array.new_float(0)
var year_time = array.new_int(0)
var year_bh  = array.new_float(0)

end_time = false

end_time:= time_close + (time_close - time_close[1]) > timenow or barstate.islastconfirmedhistory

if (not na(cur_quarter_pnl[1]) and (new_quarter or end_time))
    if (end_time[1])
        array.pop(quarter_pnl)
        array.pop(quarter_time)
        
    array.push(quarter_pnl , cur_quarter_pnl[1])
    array.push(quarter_time, time[1])
    array.push(quarter_bh , cur_quarter_bh[1])

if (not na(cur_year_pnl[1]) and (new_year or end_time))
    if (end_time[1])
        array.pop(year_pnl)
        array.pop(year_time)
        
    array.push(year_pnl , cur_year_pnl[1])
    array.push(year_time, time[1])
    array.push(year_bh , cur_year_bh[1])

// Quarterly P&L Table    
var quarterly_table = table(na)

getCellColor(pnl, bh)  => 
    if pnl > 0
        if bh < 0 or pnl > 2 * bh
            color.new(color.green, transp = 20)
        else if pnl > bh
            color.new(color.green, transp = 50)
        else
            color.new(color.green, transp = 80)
    else
        if bh > 0 or pnl < 2 * bh
            color.new(color.red, transp = 20)
        else if pnl < bh
            color.new(color.red, transp = 50)
        else
            color.new(color.red, transp = 80)

if (end_time and enableQuarterlyTable)
    quarterly_table := table.new(table_position, columns = 14, rows = array.size(year_pnl) + 1, border_width = 1)

    table.cell(quarterly_table, 0,  0, "",     bgcolor = #cccccc)
    table.cell(quarterly_table, 1,  0, "Q1",  bgcolor = #cccccc)
    table.cell(quarterly_table, 2,  0, "Q2",  bgcolor = #cccccc)
    table.cell(quarterly_table, 3,  0, "Q3",  bgcolor = #cccccc)
    table.cell(quarterly_table, 4,  0, "Q4",  bgcolor = #cccccc)
    table.cell(quarterly_table, 5,  0, "Year", bgcolor = #999999)


    for yi = 0 to array.size(year_pnl) - 1
        table.cell(quarterly_table, 0,  yi + 1, tostring(year(array.get(year_time, yi))), bgcolor = #cccccc)
        
        y_color = getCellColor(array.get(year_pnl, yi), array.get(year_bh, yi))
        table.cell(quarterly_table, 5, yi + 1, enableCompareWithMarket ? tostring(round(array.get(year_pnl, yi) * 100, precision)) + " (" + tostring(round(array.get(year_bh, yi) * 100, precision)) + ")" : tostring(round(array.get(year_pnl, yi) * 100, precision)), bgcolor = y_color, text_color=#bfbfbf)
        
    for mi = 0 to array.size(quarter_time) - 1
        m_row   = year(array.get(quarter_time, mi))  - year(array.get(year_time, 0)) + 1
        m_col   = ceil(month(array.get(quarter_time, mi)) / 3)
        m_color = getCellColor(array.get(quarter_pnl, mi), array.get(quarter_bh, mi))
        
        table.cell(quarterly_table, m_col, m_row, enableCompareWithMarket ?  tostring(round(array.get(quarter_pnl, mi) * 100, precision)) + " (" + tostring(round(array.get(quarter_bh, mi) * 100,precision)) +")" : tostring(round(array.get(quarter_pnl, mi) * 100, precision)), bgcolor = m_color, text_color=#bfbfbf)

More