概述
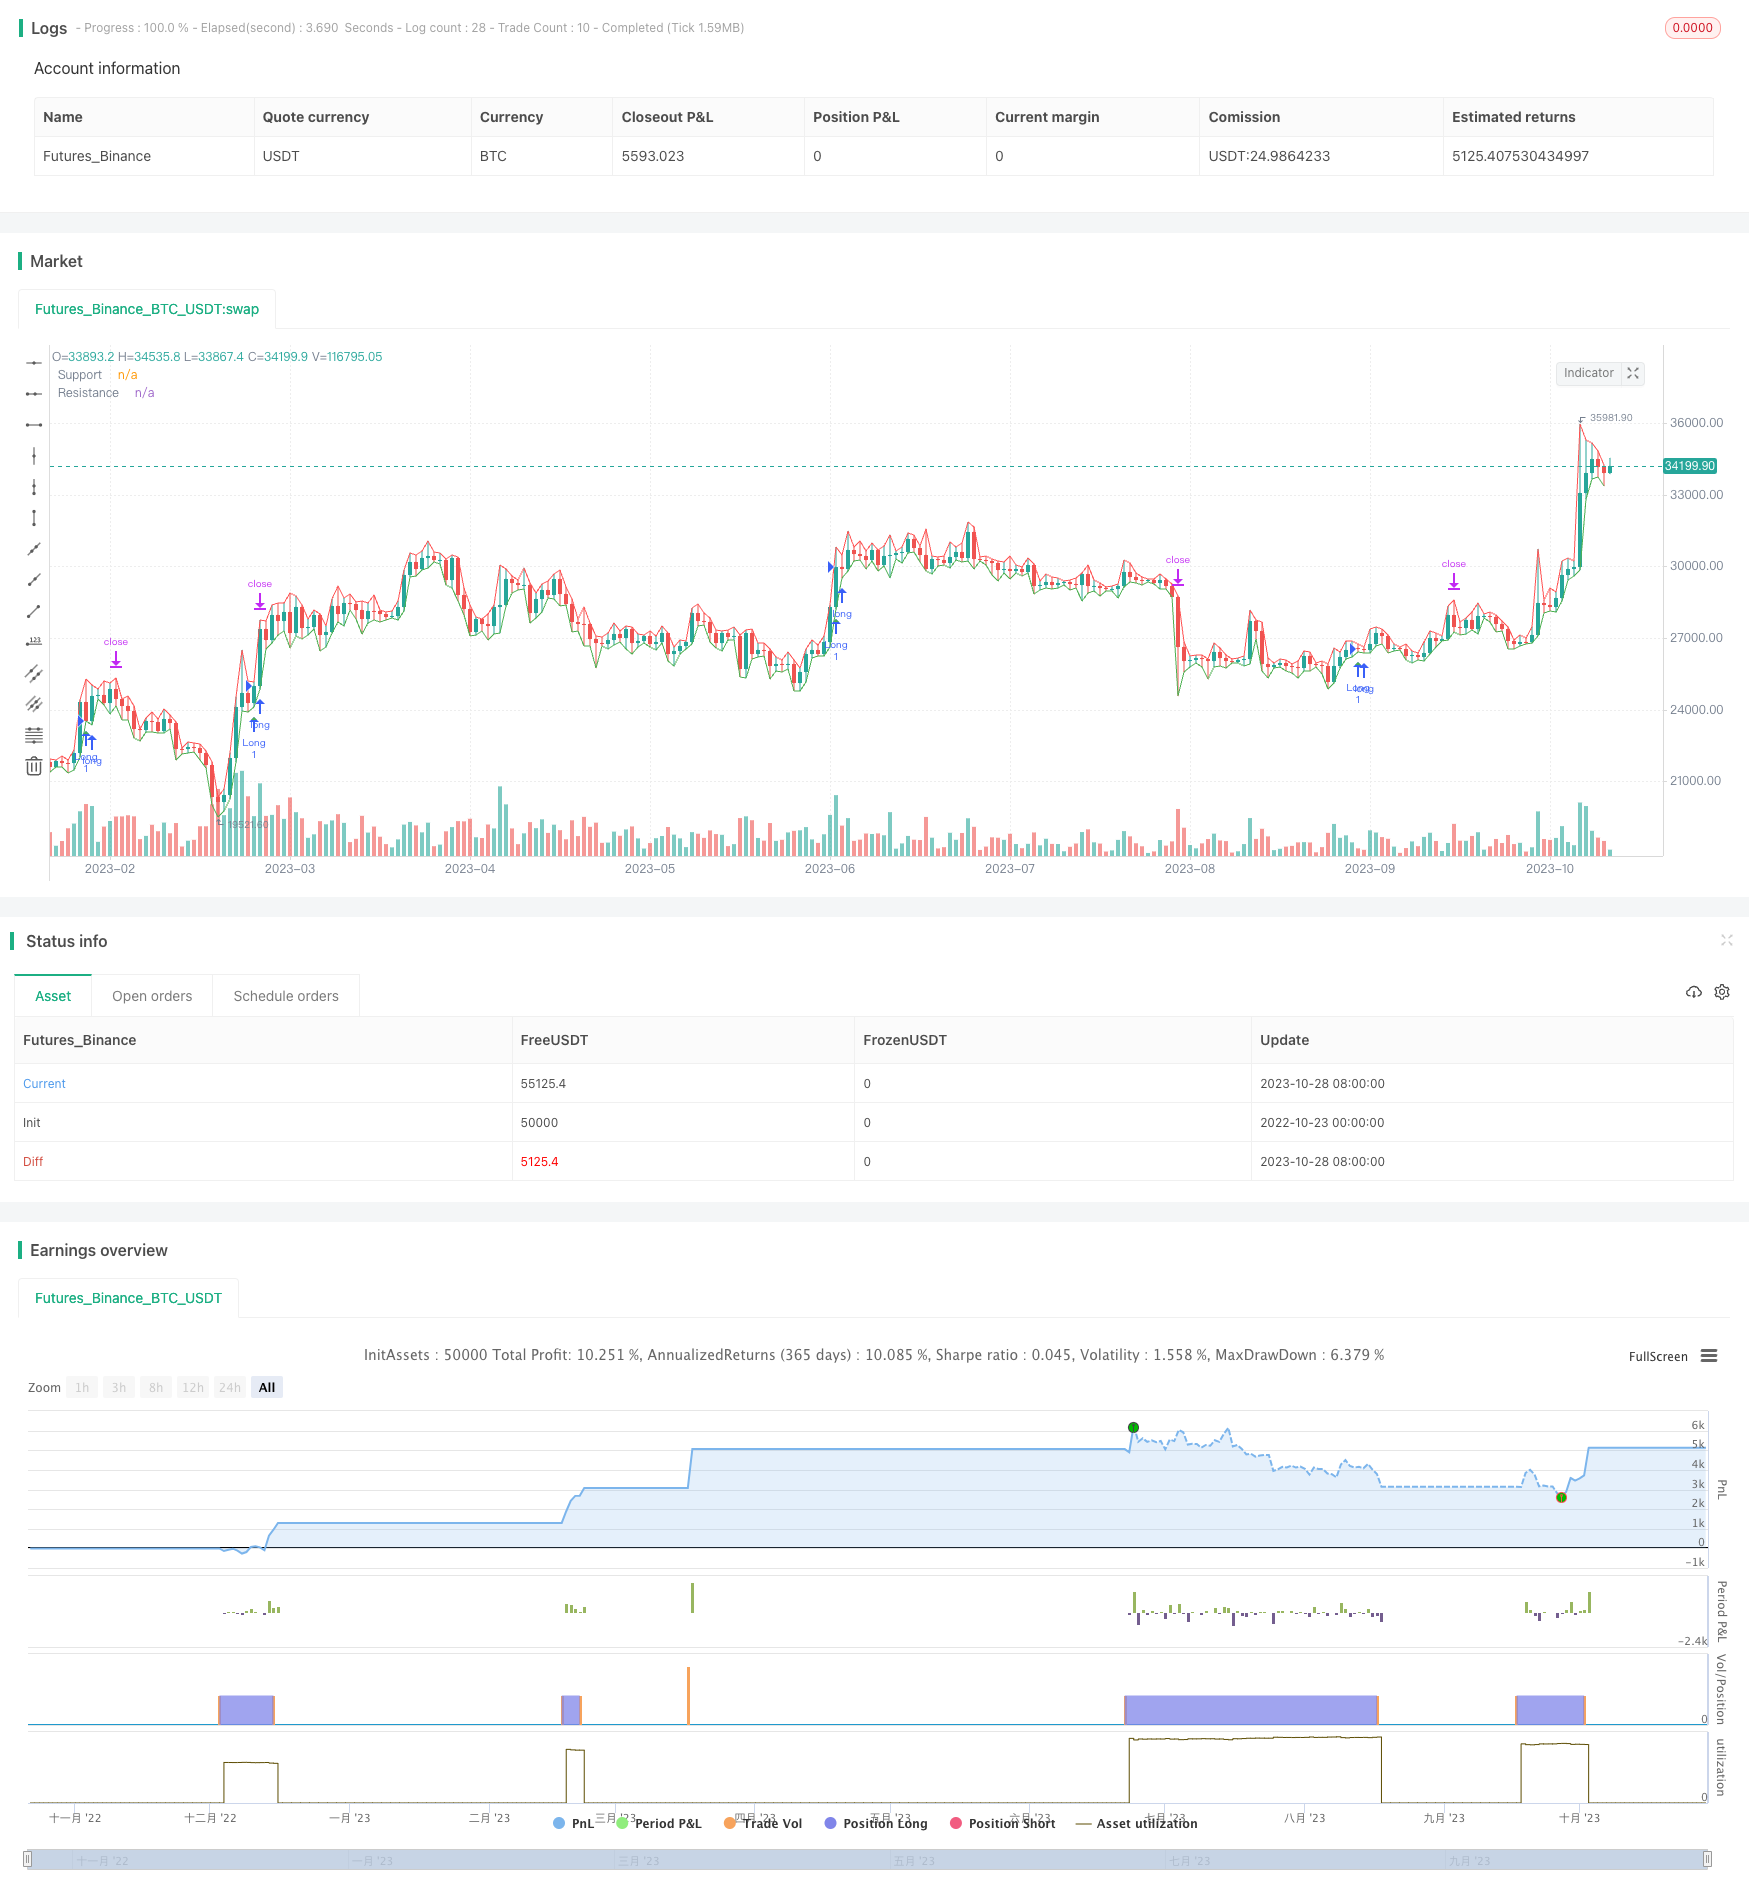
该策略结合了价格行情的支撑阻力分析和MACD指标的趋势分析,实现了在趋势方向获得确定的前提下,在关键支撑阻力区域进行低风险的长线操作,旨在获得超过止损价位的较大获利。
策略原理
通过“Price Action - Support & Resistance by DGT”指标识别关键的支撑和阻力水平。该指标基于价格行情判断支撑和阻力。这些水平通常都是价格反转或盘整的潜在区域。
在指标识别出支撑阻力水平后,需要通过分析历史价格在这些水平附近的行为,来确认支撑阻力的强度。多次触碰或反弹的水平,说明该水平的支撑或阻力效果更强。
添加MACD指标,由MACD线和Signal线以及两者之间差值的Histogram组成。MACD可识别趋势和潜在趋势反转。当MACD线上穿Signal线且Histogram为正值时,表示有望形成牛市趋势。
结合“Price Action - Support & Resistance by DGT”指标识别的支撑位和MACD指标识别的趋势方向,可以找出交易机会:
- 多头交易:当价格接近强支撑位时,如果MACD线上穿Signal线且Histogram为正值,说明有望形成多头趋势,在支撑位附近做多,并设置止损线在支撑位之下。
进入交易后,可根据入场点与最近重要的支撑或阻力之间的距离来设置盈利目标;同时采用移动止损或其他风险管理技术来锁定盈利和控制风险。
优势分析
- 利用支撑阻力识别关键的反转区域,这样的交易区域风险较低
- 借助MACD判断趋势方向,只在趋势确定时交易,避免逆势交易
- 在支撑位附近做多,止损离场,风险可控
- 目标利润较大,有望取得超过止损的较大盈利
- 支撑阻力和MACD可相互验证信号,增加成功率
风险分析
- 支撑阻力可能被突破,需要关注突破后的价格动向
- MACD具有滞后性,可能出现误判
- 止损被触发的概率存在,需要控制单笔止损风险
- 需要关注利润目标是否设置合理,过于激进可能无法实现
- 需要关注和验证各个信号,避免出现错误信号
对应风险的解决方案:
- 对支撑阻力的突破需要及时止损或反向交易
- MACD判信号时需审慎,与价格结合使用,验证信号
- 单笔止损风险控制在1-2%,避免过大亏损
- 利润目标设置不要过于激进,可适当调小
- 必须等待各信号确认之后再入场,切忌盲目跟单
优化方向
- 可以测试不同参数下的支撑阻力指标效果
- 可以优化MACD的参数,获得更精确的MACD信号
- 可以加入其它指标进行信号验证,例如RSI等
- 可以研究比如布林带等指标来设置止损和止盈
- 可以加入自动移动止损来更好地锁定利润
- 可以针对不同品种进行参数优化
- 可以通过回测来优化具体的止损止盈参数
总结
该策略整合了趋势判断和关键区域交易方法。在获得确定的趋势方向后,选择风险可控的支撑区域进行低风险操作,以期获得超过止损的较大盈利。这种长线操作模式,只需要较少的交易次数就有望取得稳定收益。当然,任何策略都无法完全避免亏损,需要采取严格的风险管理措施来控制损失。通过不断优化参数和信号验证方法,该策略可以获得更高的胜率。总体来说,该策略提供了一种较为稳健的长线交易思路。
策略源码
/*backtest
start: 2022-10-23 00:00:00
end: 2023-10-29 00:00:00
period: 1d
basePeriod: 1h
exchanges: [{"eid":"Futures_Binance","currency":"BTC_USDT"}]
*/

//@version=4
strategy("Price Action - Support & Resistance + MACD Strategy", overlay=true)

// Price Action - Support & Resistance
supportLevel = input(100, title="Support Level Strength", minval=1)
resistanceLevel = input(100, title="Resistance Level Strength", minval=1)

var supportPrice = 0.0
var resistancePrice = 0.0

if low <= supportPrice or barstate.islast
    supportPrice := low
if high >= resistancePrice or barstate.islast
    resistancePrice := high

plot(supportPrice, color=color.green, linewidth=1, title="Support")
plot(resistancePrice, color=color.red, linewidth=1, title="Resistance")

// MACD Indicator
[macdLine, signalLine, _] = macd(close, 26, 100, 9)
macdHistogram = macdLine - signalLine

// Bullish Trade Setup
bullishSetup = crossover(macdLine, signalLine) and macdHistogram > 0 and close > supportPrice
plotshape(bullishSetup, color=color.green, title="Bullish Setup", style=shape.triangleup, location=location.belowbar)

// Stop Loss and Take Profit Levels
stopLossLevel = input(5, title="Stop Loss Level (%)", minval=0.1, step=0.1)
takeProfitLevel = input(7.5, title="Take Profit Level (%)", minval=0.1, step=0.1)

// Execute Long Trades
if bullishSetup
    stopLossPrice = close * (1 - stopLossLevel / 100)
    takeProfitPrice = close * (1 + takeProfitLevel / 100)
    strategy.entry("Long", strategy.long)
    strategy.exit("Exit", "Long", stop=stopLossPrice, limit=takeProfitPrice)