Volatility Breakout Trading Strategy

Overview
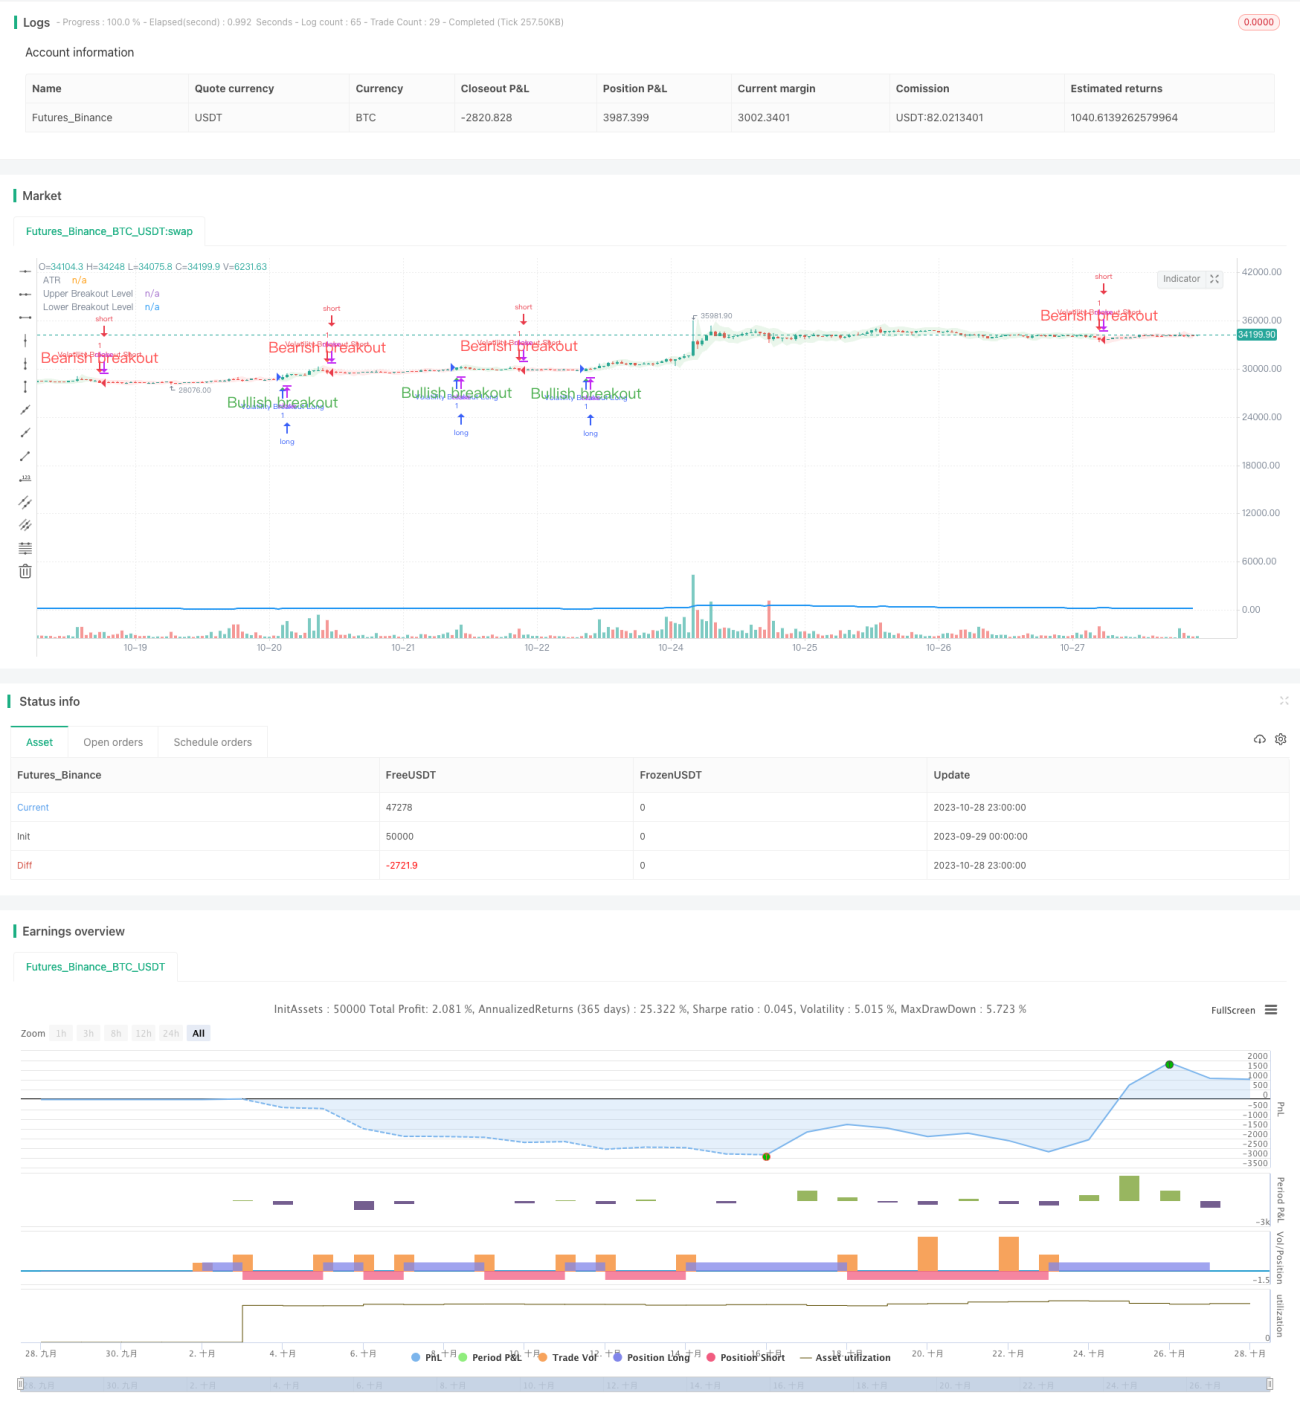
The Volatility Breakout Trading Strategy aims to capture price breakouts resulting from increased market volatility. The strategy uses the Average True Range (ATR) indicator to measure an asset's volatility over a specified period. Long and short signals are generated when the price breaks out above or below two levels determined by the ATR.
Strategy Logic
The strategy first calculates the ATR over a chosen period. It then uses the ATR to calculate an upper and lower breakout level. When the closing price breaks above the upper level, a long signal is generated. When the closing price breaks below the lower level, a short signal is generated. To further confirm the signals, the current bar needs to close for its body portion.
When the closing price breaks the upper or lower levels, the breakout zone is filled with a color indicating the breakout direction. This feature helps quickly identify the prevailing trend direction.
When a long signal is generated and there is no current position, the strategy goes long. When a short signal is generated and there is no current position, the strategy goes short.
The Length input determines the period over which volatility is measured. A higher Length value implies focusing on longer price moves. For example, with Length set to 20, each trade spans about 100 bars, capturing multiple swings.
Lowering the Length value allows targeting shorter-term price moves and potentially increasing trade frequency. There is no strict correlation between the Length input and average trade length. Optimal Length values must be found through experimentation.
Advantage Analysis
The strategy capitalizes on breakout principles to catch significant moves arising from market volatility. The ATR indicator dynamically calculates breakout levels instead of using fixed parameters.
Using solid bar closes to confirm signals filters out false breakouts. Filling the breakout zone intuitively shows trend direction.
The Length input provides flexibility to optimize the strategy for specific market conditions.
Risk Analysis
Breakout trading carries the risk of being stopped out. Stop losses can control loss on individual trades.
Breakout signals may generate false signals leading to over-trading. Length values can be adjusted to filter out false signals.
Parameter optimization requires sufficient trading data. Poor initial parameters can lead to underperformance.
Optimization Opportunities
Bollinger Bands can be introduced within the ATR period to calculate new breakout levels. Bollinger breakouts reduce false signals.
Trends can be further tracked after breakouts instead of stopping out immediately. Trailing stops can be incorporated.
Different parameters or avoiding trades altogether can be considered in range-bound markets to prevent whipsaws.
Conclusion
The Volatility Breakout Trading Strategy capitalizes on increased market volatility to enter trending moves when prices break out significantly. The ATR indicator dynamically sets breakout levels and solid bars filter false breakouts. The Length input provides flexibility to adjust the strategy's period. The strategy is suitable for medium to long-term trend following, but breakout risks must be managed through parameter optimization.
/*backtest
start: 2023-09-29 00:00:00
end: 2023-10-29 00:00:00
period: 1h
basePeriod: 15m
exchanges: [{"eid":"Futures_Binance","currency":"BTC_USDT"}]
*/

// This source code is subject to the terms of the Mozilla Public License 2.0 at https://mozilla.org/MPL/2.0/

//@version=5
strategy("Volatility Breakout Strategy [Angel Algo]", overlay = true)- 1