Trend Trading Strategy Based on EMA Crossover

Author: ChaoZhang, Date: 2023-10-31 14:37:38
Tags:

img

Overview

The core idea of this strategy is to use the golden cross and dead cross signals of the EMA indicator to make buy and sell decisions. It plots multiple sets of fast and slow EMAs and generates trading signals based on their crossover.

Strategy Logic

The strategy first defines multiple EMA lines, including fast EMAs ema1 to ema6 and slow EMAs ema7 to ema12. It then defines the buy signal buy_signal and sell signal sell_signal:

  • The buy signal buy_signal is generated when ema1 crosses above ema3.

  • The sell signal sell_signal is generated when ema1 crosses below ema3.

So when the short-term EMA crosses above the long-term EMA, it indicates an upward trend in the market and a buy signal is triggered. When the short-term EMA crosses below the long-term EMA, it indicates a downward trend and a sell signal is triggered.

The strategy monitors the crossover of the EMA lines to determine the trend direction and make buy/sell decisions accordingly.

Advantage Analysis

The advantages of this strategy include:

  1. Using EMA lines to determine the trend can filter out short-term market noise and make trading signals more reliable.

  2. Plotting multiple EMAs can identify trend changes more accurately. Crossovers between fast and slow EMAs help capture important trend turning points.

  3. The strategy is simple and clear. Trading signals are generated by EMA crosses, making it easy to understand and implement for quant trading.

  4. The EMA period parameters are customizable to adapt to different products and markets.

Risk Analysis

The risks of this strategy include:

  1. EMA lines have lagging effects which may delay trading signals.

  2. Improper selection of EMA parameters may generate incorrect signals.

  3. EMA crosses fail to filter out false signals in ranging markets effectively.

  4. Overfitting risks exist due to limited optimizable space for EMA parameters.

Solutions:

  1. Add filters with other indicators to avoid wrong signals in ranging markets.

  2. Test stability of different period parameters to prevent overfitting.

  3. Adjust parameters or add exit mechanisms to control risks.

Optimization Directions

The strategy can be further optimized in the following aspects:

  1. Add stop loss to exit positions when losses reach a threshold.

  2. Implement re-entry logic with additional buy/sell signals.

  3. Optimize EMA crossover period parameters for best results.

  4. Incorporate other indicators for multifactorial validation to improve signal quality.

  5. Test parameter tuning on different products to find optimal applicability.

  6. Consider slippage in live trading and optimize via backtesting.

Summary

This is a simple trend following strategy based on EMA crossover. It can identify trend changes but also has risks like lagging effects and whipsaws. Enhancements with stop loss, parameter optimization, multifactorial validation etc. can further improve strategy performance in backtesting and live trading.
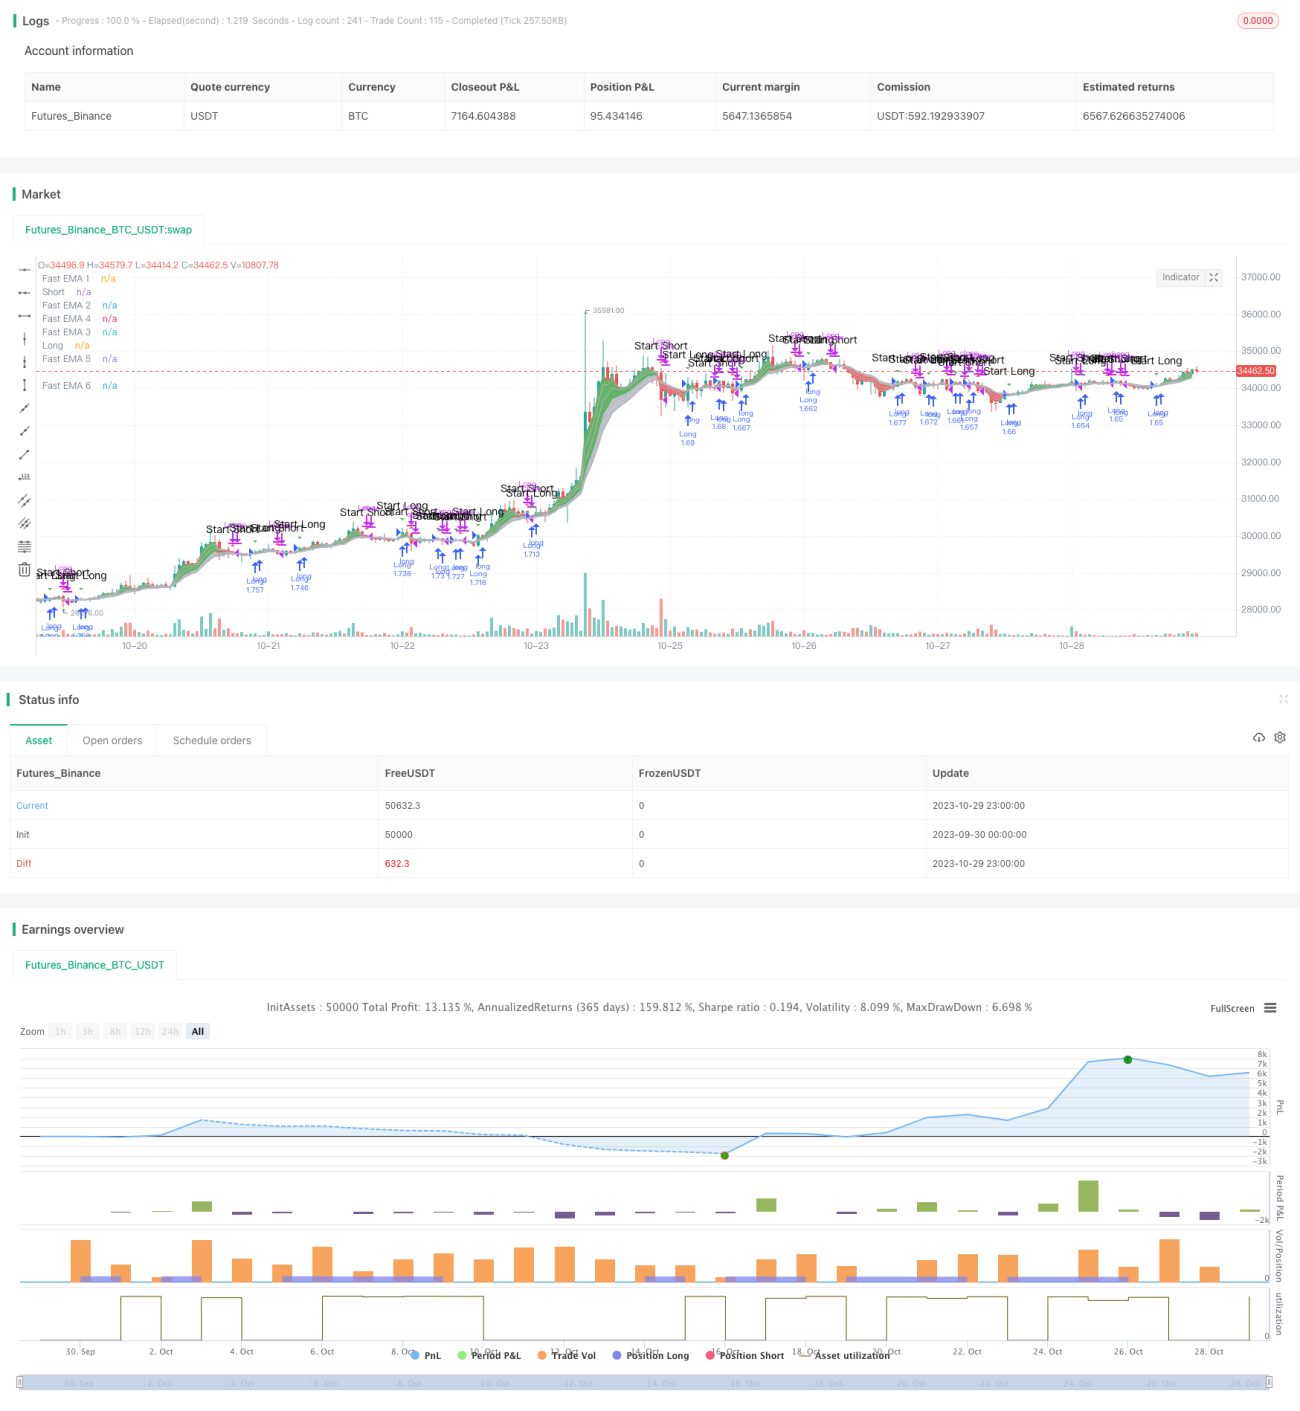

/*backtest
start: 2023-09-30 00:00:00
end: 2023-10-30 00:00:00
period: 1h
basePeriod: 15m
exchanges: [{"eid":"Futures_Binance","currency":"BTC_USDT"}]
*/

//@version=3
//Companion Strategy script to my Cloud Study. Enjoy! -MP
// study("MP's Cloud Study", overlay=true)
strategy(title="MP's Cloud Strat'", shorttitle="MP's Cloud Strat", overlay=true, precision=6, pyramiding=0, initial_capital=10000, currency="USD", default_qty_type=strategy.percent_of_equity,calc_on_order_fills= false, calc_on_every_tick=false, default_qty_value=100.0, commission_type=strategy.commission.percent, commission_value=0.05)

//bgcolor ( color=black, transp=20, title='Blackground', editable=true)

src = close, len1 = input(2, minval=1, title="Short EMA")
src2 = close, len3 = input(7, minval=1, title="Long EMA")
emaShort = ema(src, len1)
emaLong = ema(src2, len3)


StartYear = input(2018, "Start Year")
StartMonth = input(01, "Start Month")
StartDay = input(18, "Start Day")

 
StopYear = input(2018, "Stop Year")
StopMonth = input(12, "Stop Month")
StopDay = input(26, "Stop Day")
tradeStop = timestamp(StopYear,StopMonth,StopDay,0,0)

//src = close, 
//len1 = input(3, minval=1, title="Fast EMA 1")
len2 = input(3, minval=1, title="Fast EMA 2")
//len3 = input(8, minval=1, title="Fast EMA 3")
len4 = input(5, minval=1, title="Fast EMA 4")
len5 = input(8, minval=1, title="Fast EMA 5")
len6 = input(10, minval=1, title="Fast EMA 6")
//Slow EMA
len7 = input(30, minval=1, title="Slow EMA 7")
len8 = input(35, minval=1, title="Slow EMA 8")
len9 = input(40, minval=1, title="Slow EMA 9")
len10 = input(45, minval=1, title="Slow EMA 10")
len11 = input(50, minval=1, title="Slow EMA 11")
len12 = input(60, minval=1, title="Slow EMA 12")

//Fast EMA
ema1 = ema(src, len1)
ema2 = ema(src, len2)
ema3 = ema(src, len3)
ema4 = ema(src, len4)
ema5 = ema(src, len5)
ema6 = ema(src, len6)
//Slow EMA
ema7 = ema(src, len7)
ema8 = ema(src, len8)
ema9 = ema(src, len9)
ema10 = ema(src, len10)
ema11 = ema(src, len11)
ema12 = ema(src, len12)

//Fast EMA Color Rules
//colfastL = (ema1 > ema2 and ema2 > ema3 and ema3 > ema4 and ema4 > ema5 and ema5 > ema6)
colfastS = (ema1 < ema2 and ema2 < ema3 and ema3 < ema4 and ema4 < ema5 and ema5 < ema6)
//Slow EMA Color Rules
//colslowL = ema7 > ema8 and ema8 > ema9 and ema9 > ema10 and ema10 > ema11 and ema11 > ema12 
//colslowS = ema7 < ema8 and ema8 < ema9 and ema9 < ema10 and ema10 < ema11 and ema11 < ema12 
//Fast EMA Final Color Rules
//colFinal = colfastL and colslowL? aqua : colfastS and colslowS? orange : gray
//Slow EMA Final Color Rules
//colFinal2 = colslowL  ? lime : colslowS ? red : gray
//Fast EMA Plots
p1=plot(ema1, title="Fast EMA 1", style=line, linewidth=2, color=silver)
plot(ema2, title="Fast EMA 2", style=line, linewidth=1, color=silver)
plot(ema3, title="Fast EMA 3", style=line, linewidth=1, color=silver)
plot(ema4, title="Fast EMA 4", style=line, linewidth=1, color=silver)
plot(ema5, title="Fast EMA 5", style=line, linewidth=1, color=silver)
p2=plot(ema6, title="Fast EMA 6", style=line, linewidth=2, color=silver)
fill(p1,p2,color=silver, transp=60)
//Slow EMA Plots
//p3=plot(ema7, title="Slow EMA 7", style=line, linewidth=4, color=colFinal2)
//plot(ema8, title="Slow EMA 8", style=line, linewidth=3, color=colFinal2)
//plot(ema9, title="Slow EMA 9", style=line, linewidth=3, color=colFinal2)
//plot(ema10, title="Slow EMA 10", style=line, linewidth=3, color=colFinal2)
//plot(ema11, title="Slow EMA 11", style=line, linewidth=3, color=colFinal2)
//p4=plot(ema12, title="Slow EMA 12", style=line, linewidth=4, color=colFinal2)
//fill(p3,p4, color=silver, transp=60)


//Plot the Ribbon
ma1=plot( emaShort,color=rising(emaShort,2)?green:red,linewidth=1,join=true,transp=20,title="Short")
ma2=plot( emaLong,color=rising(emaLong,2)?green:red,linewidth=1,join=true,transp=20,title="Long")
fcolor = emaShort>emaLong?green:red
fill(ma1,ma2,color=fcolor,transp=80,title="Ribbon Fill")


//fast = 4, slow = 16
//fastMA = ema(close, fast)
//slowMA = ema(close, slow)
//plot(fastMA, color=green, title = "buy/sell")
//plot(slowMA, color=red, title = "base")


//Conditions
buy_signal = crossover(ema1,ema3)
sell_signal = crossunder(ema1,ema3)

plotshape(sell_signal, style=shape.triangleup, color = red, text="Start Short")
plotshape(buy_signal, style=shape.triangledown, color = green, text="Start Long")

alertcondition(sell_signal, title = 'Sell/Short', message = 'e= s= c=position b=long t=market l= | delay=30 | e= s= b=short l= t=market q=0.01')
alertcondition(buy_signal, title = 'Buy/Long', message =  'e= s= c=position b=short t=market l= | delay=30 | e= s= b=long l= t=market q=0.01')

//alertcondition(sell_signal, title = 'Sell/Short', message = 'e= s= c=order b=buy | delay=3 | e= b=sell q=99% p=0.70% u=currency')
//alertcondition(buy_signal, title = 'Buy/Long', message =  'e= s= c=order b=sell | delay=30 | e= b=buy q=80 p=0.1% u=currency')


testStartYear = input(2018, "From Year") 
testStartMonth = input(1, "From Month")
testStartDay = input(1, "From Day")
testPeriodStart = timestamp(testStartYear,testStartMonth,testStartDay,0,0)

testStopYear = input(2019, "To Year")
testStopMonth = input(1, "To Month")
testStopDay = input(1, "To Day")
testPeriodStop = timestamp(testStopYear,testStopMonth,testStopDay,0,0)

testPeriod() => true

if testPeriod()
    if buy_signal
        strategy.entry("Long", true)
    

    if sell_signal
        strategy.close("Long")

More