概述
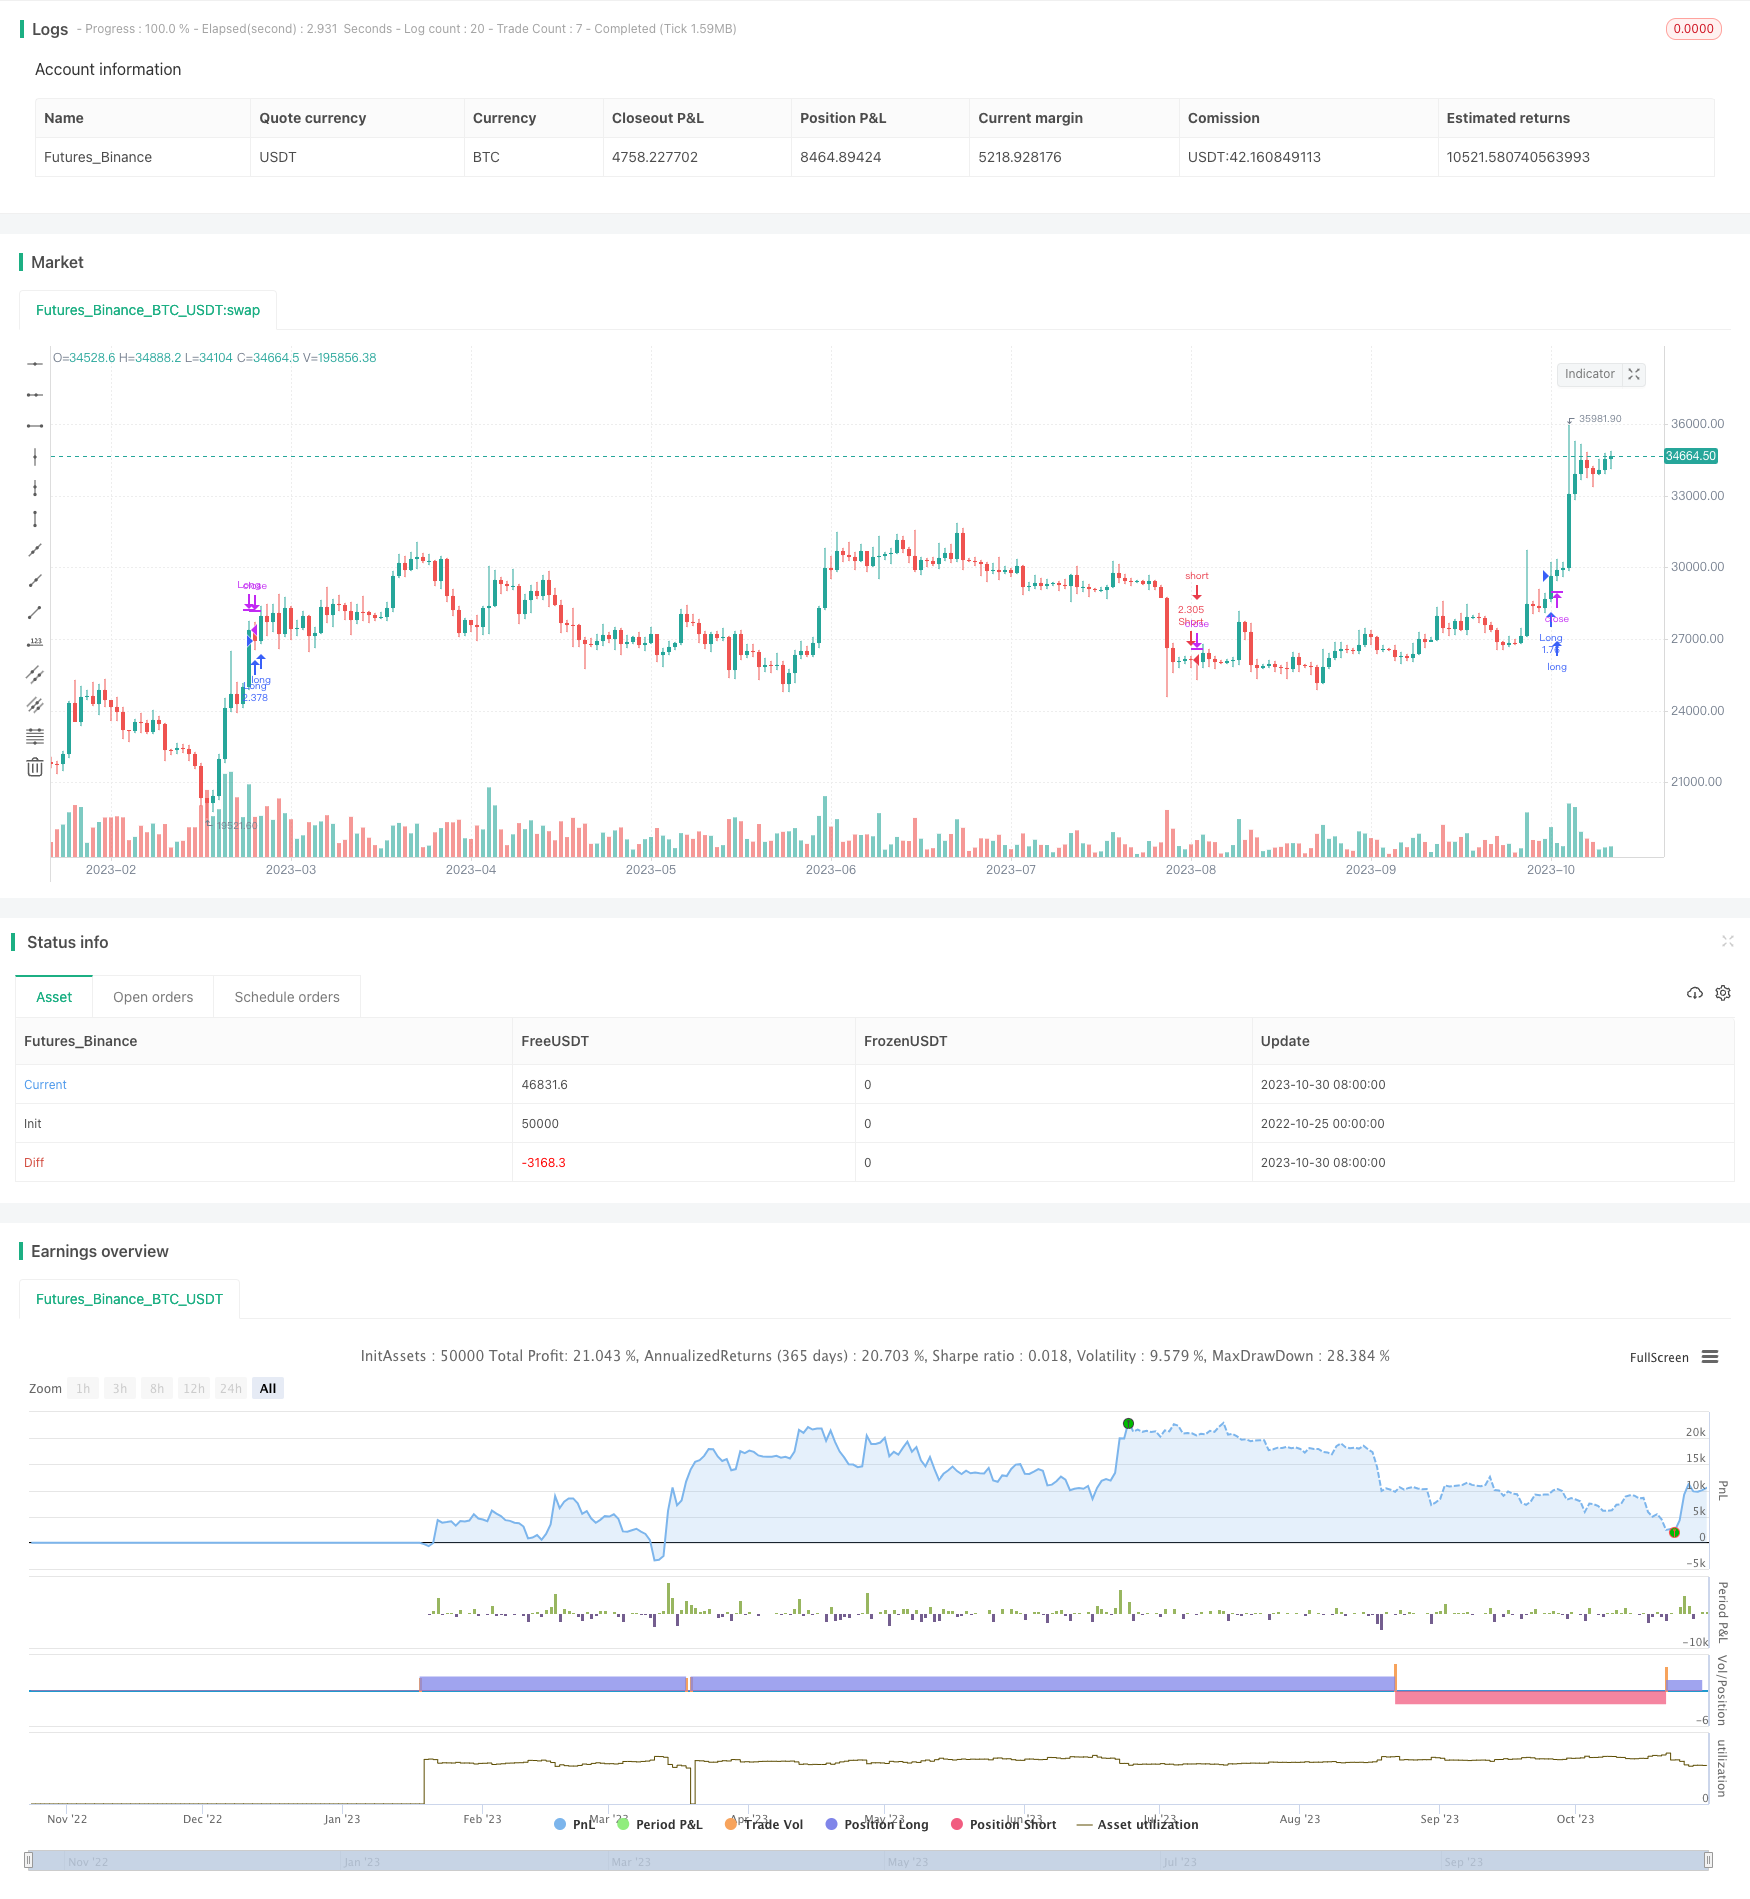
该策略基于华尔街捕鼠光环指标,对比基准加密货币市场的涨跌态势,实现对目标加密货币进行看涨看跌操作的自动交易策略。策略可根据不同加密货币设置支持度指标参数,实现对多种加密货币的跟踪交易。
策略原理
计算基准加密货币的华尔街捕鼠光环指标均线,设置均线长度为200周期。
判断均线的涨跌状态:当均线上涨时,策略采取看涨操作;当均线下跌时,策略采取看跌操作。
策略根据均线的涨跌状态,以及当前头寸情况,实现自动开仓和平仓:
当均线上涨且当前无头寸时,策略市价自动开仓做多;
当均线下跌且当前无头寸时,策略市价自动开仓做空;
当做多头寸利润达到设置的止盈比例时,策略市价自动平掉做多单;
当做空头寸利润达到设置的止盈比例时,策略市价自动平掉做空单;
当做多头寸亏损达到设置的止损比例时,策略市价自动平掉做多单;
当做空头寸亏损达到设置的止损比例时,策略市价自动平掉做空单。
策略根据基准加密货币行情变化,实时更新止盈止损价格。
优势分析
策略具有较强的适应性,可针对不同的加密货币设置不同的参数,实现对多种加密货币的跟踪交易。
利用华尔街捕鼠光环指标判断市场趋势,可避免噪音导致的错误交易。该指标对突破上下轨有一定的滞后性,可以减少虚假突破带来的损失。
策略加入止盈止损机制,可以把握趋势进行追涨杀跌,且可控制单笔损失。
策略进行全自动化交易,无需人工干预,可24小时运行。
风险分析
存在某些加密货币价格与基准加密货币脱钩的可能,从而导致策略无法正常交易的风险。可以优化为采用多个基准加密货币计算相关系数,选择相关性最强的基准加密货币。
存在由于市场异常波动导致止损被突破的风险。可以适当调整止损比例或加入止损追踪。
存在止盈比例设置过小导致无法捕捉足够趋势收益的风险。可以加入趋势跟踪或动态止盈。
存在假突破导致平仓止损的风险。可以适当调整指标参数, identificationsettings或加入再入场机制。
优化方向
利用相关性分析选择多个基准加密货币,组合计算指标,降低单一基准货币风险。
增加趋势跟踪机制,根据波动率动态调整止盈止损。
增加级别止损,防止极端行情止损被突破。
增加再入场机制,避免止损后错过后续行情。
优化指标参数,identificationsettings,提高指标效果。
针对不同加密货币分别优化参数,提升策略适应性。
优化仓位管理,根据资金规模动态调整仓位。
总结
该策略整体来看是一种典型的趋势跟踪策略。核心思路是根据华尔街捕鼠光环指标判断基准加密货币的趋势方向,以此来确定目标加密货币的交易方向。策略具有一定的优势,但也存在一些风险需要注意。通过持续优化参数以及增加趋势跟踪、风险控制等机制,可以进一步增强策略的稳定性和收益率。总体来说,该策略为自动化程序化加密货币交易提供了思路和借鉴。
/*backtest
start: 2022-10-25 00:00:00
end: 2023-10-31 00:00:00
period: 1d
basePeriod: 1h
exchanges: [{"eid":"Futures_Binance","currency":"BTC_USDT"}]
*/

// This source code is subject to the terms of the Mozilla Public License 2.0 at https://mozilla.org/MPL/2.0/
// © levieux

//@version=5
strategy(title='Correlation Strategy', shorttitle='Correlation Strategy', initial_capital=1000, overlay=true, default_qty_type=strategy.percent_of_equity, default_qty_value=100, commission_type=strategy.commission.percent, commission_value=0.1)

supportLength = input.int(200, minval=1, title='Support Length')
supportSymbol = input('BTC_USDT:swap', title='Correlated Symbol')
supportSource = input(hlc3, title='Price Source')
takeprofitLong = input.float(0.2, 'Take Profit Long', step=0.01)
takeprofitShort = input.float(0.15, 'Take Profit Short', step=0.01)
stoplossLong = input.float(0.1, 'Stop Loss Long', step=0.01)
stoplossShort = input.float(0.04, 'Stop Loss Short', step=0.01)
start = input(defval = timestamp("01 Jan 2016 00:00 +0000"), title = "Start Time")
end = input(defval = timestamp("31 Dec 2050 23:59 +0000"), title = "End Time")

supportTicker = request.security(supportSymbol, timeframe.period, supportSource, lookahead=barmerge.lookahead_off)  //input(close, title="Source")
supportLine = ta.wma(supportTicker, supportLength)

window() => true

if not window()
    strategy.cancel_all()

supportLongPrice = close
supportShortPrice = close

if strategy.position_size > 0
    supportLongPrice := supportLongPrice[1]
if strategy.position_size < 0
    supportShortPrice := supportShortPrice[1]

longCondition = ta.rising(supportLine, 5) and window() and strategy.position_size <= 0
shortCondition = ta.falling(supportLine, 5) and window() and window() and strategy.position_size > 0
takeprofitLongCondition = takeprofitLong > 0 and window() and strategy.position_size > 0 and supportTicker > supportLongPrice * (1 + takeprofitLong)
stoplossLongCondition = stoplossLong > 0 and window() and strategy.position_size > 0 and supportTicker < supportLongPrice * (1 - stoplossLong)
takeprofitShortCondition = takeprofitShort > 0 and window() and strategy.position_size < 0 and supportTicker > supportShortPrice * (1 + takeprofitShort)
stoplossShortCondition = stoplossShort > 0 and window() and strategy.position_size < 0 and supportTicker < supportShortPrice * (1 - stoplossShort)

if longCondition
    strategy.entry('Long', strategy.long)
    supportLongPrice := supportTicker

if shortCondition
    strategy.entry('Short', strategy.short)
    supportShortPrice := supportTicker

if takeprofitLongCondition
    strategy.close('Long')
if stoplossLongCondition
    strategy.close('Long')
if takeprofitShortCondition
    strategy.close('Short')
if stoplossShortCondition
    strategy.close('Short')

///////////////////
// MONTHLY TABLE //

new_month = month(time) != month(time[1])
new_year  = year(time)  != year(time[1])

eq = strategy.equity

bar_pnl = eq / eq[1] - 1
bar_bh = (close-close[1])/close[1]

cur_month_pnl = 0.0
cur_year_pnl  = 0.0
cur_month_bh = 0.0
cur_year_bh  = 0.0

// Current Monthly P&L
cur_month_pnl := new_month ? 0.0 :
                 (1 + cur_month_pnl[1]) * (1 + bar_pnl) - 1
cur_month_bh := new_month ? 0.0 :
                 (1 + cur_month_bh[1]) * (1 + bar_bh) - 1

// Current Yearly P&L
cur_year_pnl := new_year ? 0.0 :
                 (1 + cur_year_pnl[1]) * (1 + bar_pnl) - 1
cur_year_bh := new_year ? 0.0 :
                 (1 + cur_year_bh[1]) * (1 + bar_bh) - 1

// Arrays to store Yearly and Monthly P&Ls
var month_pnl  = array.new_float(0)
var month_time = array.new_int(0)
var month_bh  = array.new_float(0)

var year_pnl  = array.new_float(0)
var year_time = array.new_int(0)
var year_bh  = array.new_float(0)

end_time = false

end_time:= time_close + (time_close - time_close[1]) > timenow or barstate.islastconfirmedhistory

if (not na(cur_month_pnl[1]) and (new_month or end_time))
    if (end_time[1])
        array.pop(month_pnl)
        array.pop(month_time)

    array.push(month_pnl , cur_month_pnl[1])
    array.push(month_time, time[1])
    array.push(month_bh , cur_month_bh[1])

if (not na(cur_year_pnl[1]) and (new_year or end_time))
    if (end_time[1])
        array.pop(year_pnl)
        array.pop(year_time)

    array.push(year_pnl , cur_year_pnl[1])
    array.push(year_time, time[1])
    array.push(year_bh , cur_year_bh[1])

// Monthly P&L Table
var monthly_table = table(na)

getCellColor(pnl, bh)  =>
    if pnl > 0
        if bh < 0 or pnl > 2 * bh
            color.new(color.green, transp = 20)
        else if pnl > bh
            color.new(color.green, transp = 50)
        else
            color.new(color.green, transp = 80)
    else
        if bh > 0 or pnl < 2 * bh
            color.new(color.red, transp = 20)
        else if pnl < bh
            color.new(color.red, transp = 50)
        else
            color.new(color.red, transp = 80)

if end_time
    monthly_table := table.new(position.bottom_right, columns = 14, rows = array.size(year_pnl) + 1, border_width = 1)

    table.cell(monthly_table, 0,  0, "",     bgcolor = #cccccc)
    table.cell(monthly_table, 1,  0, "Jan",  bgcolor = #cccccc)
    table.cell(monthly_table, 2,  0, "Feb",  bgcolor = #cccccc)
    table.cell(monthly_table, 3,  0, "Mar",  bgcolor = #cccccc)
    table.cell(monthly_table, 4,  0, "Apr",  bgcolor = #cccccc)
    table.cell(monthly_table, 5,  0, "May",  bgcolor = #cccccc)
    table.cell(monthly_table, 6,  0, "Jun",  bgcolor = #cccccc)
    table.cell(monthly_table, 7,  0, "Jul",  bgcolor = #cccccc)
    table.cell(monthly_table, 8,  0, "Aug",  bgcolor = #cccccc)
    table.cell(monthly_table, 9,  0, "Sep",  bgcolor = #cccccc)
    table.cell(monthly_table, 10, 0, "Oct",  bgcolor = #cccccc)
    table.cell(monthly_table, 11, 0, "Nov",  bgcolor = #cccccc)
    table.cell(monthly_table, 12, 0, "Dec",  bgcolor = #cccccc)
    table.cell(monthly_table, 13, 0, "Year", bgcolor = #999999)


    for yi = 0 to array.size(year_pnl) - 1
        table.cell(monthly_table, 0,  yi + 1, str.tostring(year(array.get(year_time, yi))), bgcolor = #cccccc)

        y_color = getCellColor(array.get(year_pnl, yi), array.get(year_bh, yi))
        table.cell(monthly_table, 13, yi + 1, str.tostring(math.round(array.get(year_pnl, yi) * 100)) + " (" + str.tostring(math.round(array.get(year_bh, yi) * 100)) + ")", bgcolor = y_color)

    for mi = 0 to array.size(month_time) - 1
        m_row   = year(array.get(month_time, mi))  - year(array.get(year_time, 0)) + 1
        m_col   = month(array.get(month_time, mi))
        m_color = getCellColor(array.get(month_pnl, mi), array.get(month_bh, mi))

        table.cell(monthly_table, m_col, m_row, str.tostring(math.round(array.get(month_pnl, mi) * 100)) + " (" + str.tostring(math.round(array.get(month_bh, mi) * 100)) +")", bgcolor = m_color)