Trend Following Strategy with Dynamic Stops

Overview
This strategy generates trading signals when price crosses EMA and uses ATR as a dynamic stop loss to manage risks.
How It Works
The key logic is:
-
Calculate ATR as the stop loss line, ATR value determines stop distance nLoss
-
Price source is close price by default, use Heikin Ashi close if Heikin Ashi option h is enabled
-
xATRTrailingStop tracks dynamic stop loss line based on price comparison with previous stop
-
Position pos is 1 for long when price crosses above stop loss line, -1 for short when crosses below, else 0
-
EMA crossover signals, above EMA is buy signal, below is sell signal
-
Enter trades on buy/sell signals, exit on opposite signals
-
Color bars based on position, mark signals and stop loss lines
This strategy follows trends with dynamic stops based on ATR. It can identify trends and manage risks effectively.
Advantages
The advantages are:
-
ATR-based dynamic stop adapts to market volatility
-
EMA filter reduces false signals from noise
-
Optional Heikin Ashi filters noise and identifies trend
-
Clear long/short position avoids whipsaws from trailing stop订单的翻译结果:
-
Visual aids like lines, labels and coloring
-
Simple and easy to understand logic for modifying
-
Customizable ATR period and multiplier for different markets
In summary, by combining trend following and dynamic stops, this strategy can catch trends and manage risks well for swing trading.
Risks
There are some risks to consider:
-
EMA signals may lag missing short-term moves
-
Frequent stop loss triggers possible in choppy markets
-
No consideration of costs like commissions
-
Lack of position sizing control
-
Performance depends on parameter tuning
-
Risk of whipsaws in ranging markets
-
Requires monitoring and intervention
Risks can be reduced by optimizing parameters, adding filters, sizing positions properly, monitoring performance, and intervening when necessary.
Optimization
Some ways to improve the strategy:
-
Adjust ATR parameters for different markets
-
Test other moving averages to filter signals
-
Add trend filter indicators for higher probability
-
Implement position sizing limits
-
Add entry conditions like volume, distance from MA
-
Incorporate costs like commissions into stops
-
Optimize entry and exit timing with more signals
-
Introduce profit taking or trailing stops
-
Automated parameter optimization
By combining more techniques for entries, exits, filters, and parameter tuning, the strategy can be further robustified.
Conclusion
This strategy combines dynamic stops and trend following nicely. With effective stops, smooth trend tracking, ease of use, and customizability, it is suitable for swing trading trends. But proper risk management, monitoring, and parameter tuning is required. When applied well on trending markets, good results can be achieved. Overall it provides a simple and practical approach to combining trend trading and risk management.
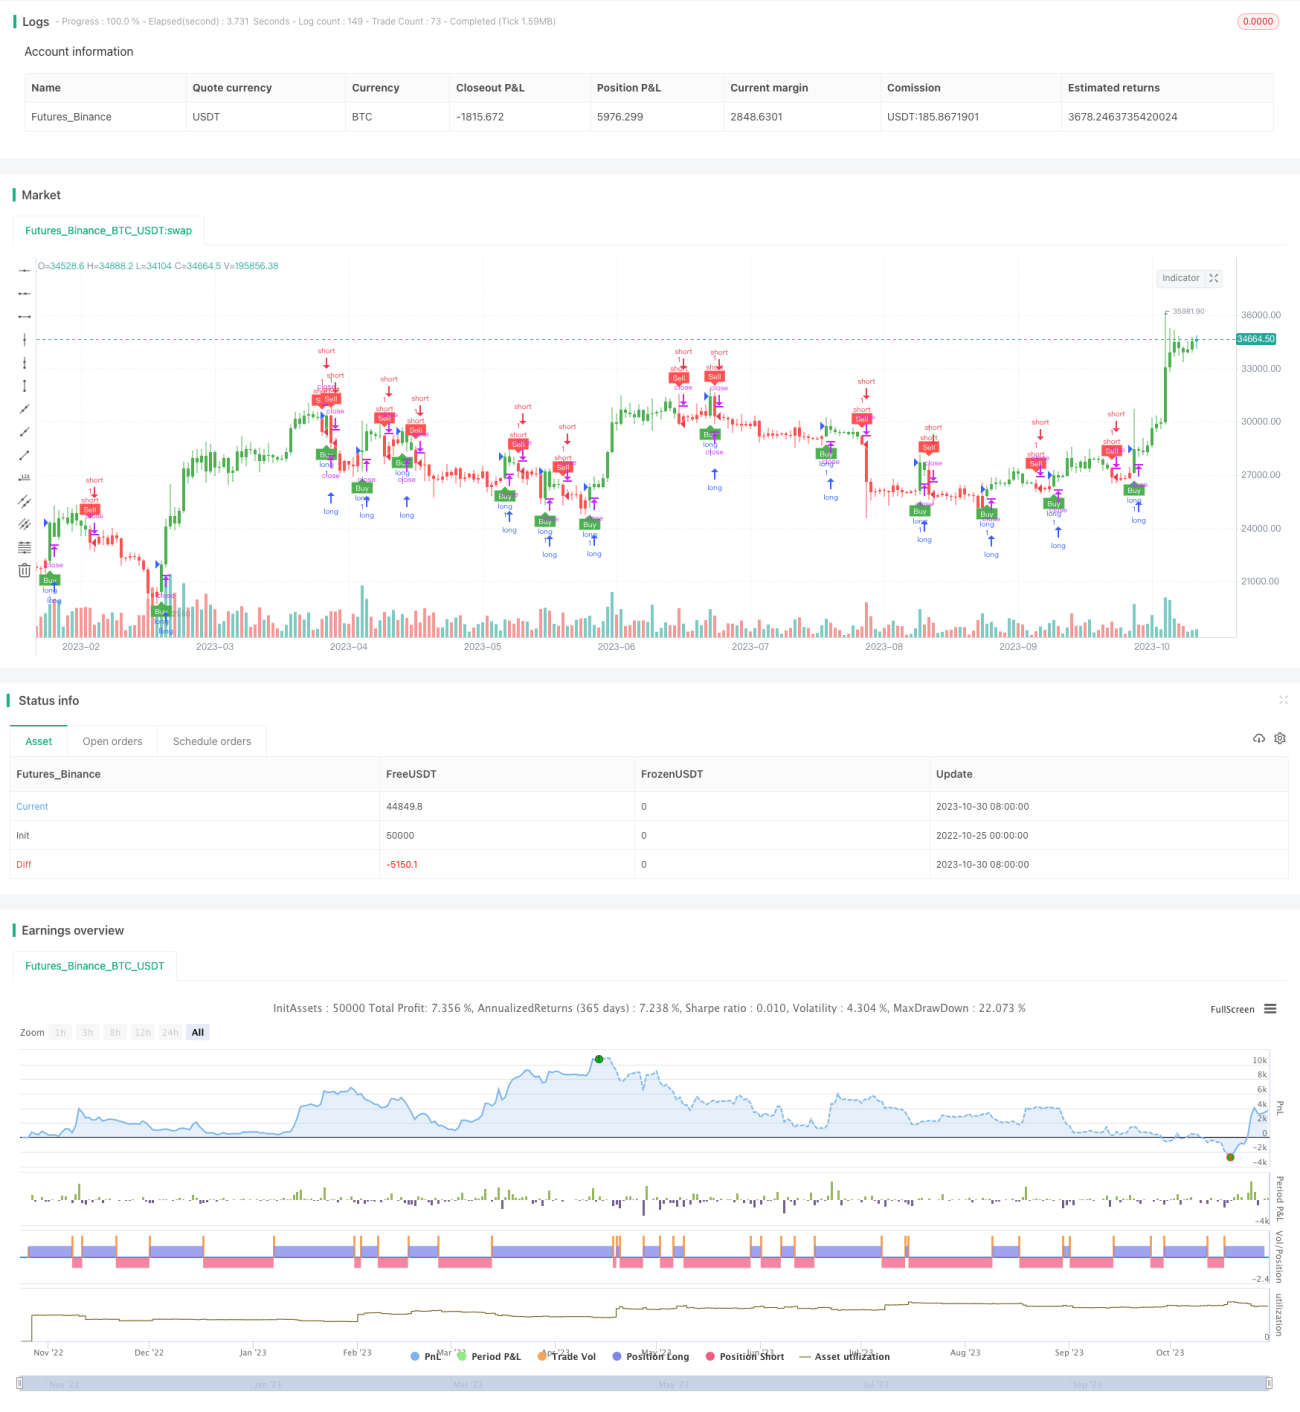
/*backtest
start: 2022-10-25 00:00:00
end: 2023-10-31 00:00:00
period: 1d
basePeriod: 1h
exchanges: [{"eid":"Futures_Binance","currency":"BTC_USDT"}]
*/

//@version=4
strategy(title="UT Bot Strategy", overlay = true)
//CREDITS to HPotter for the orginal code. The guy trying to sell this as his own is a scammer lol.
- 1