Classic Dual Trend Tracking Strategy

Overview
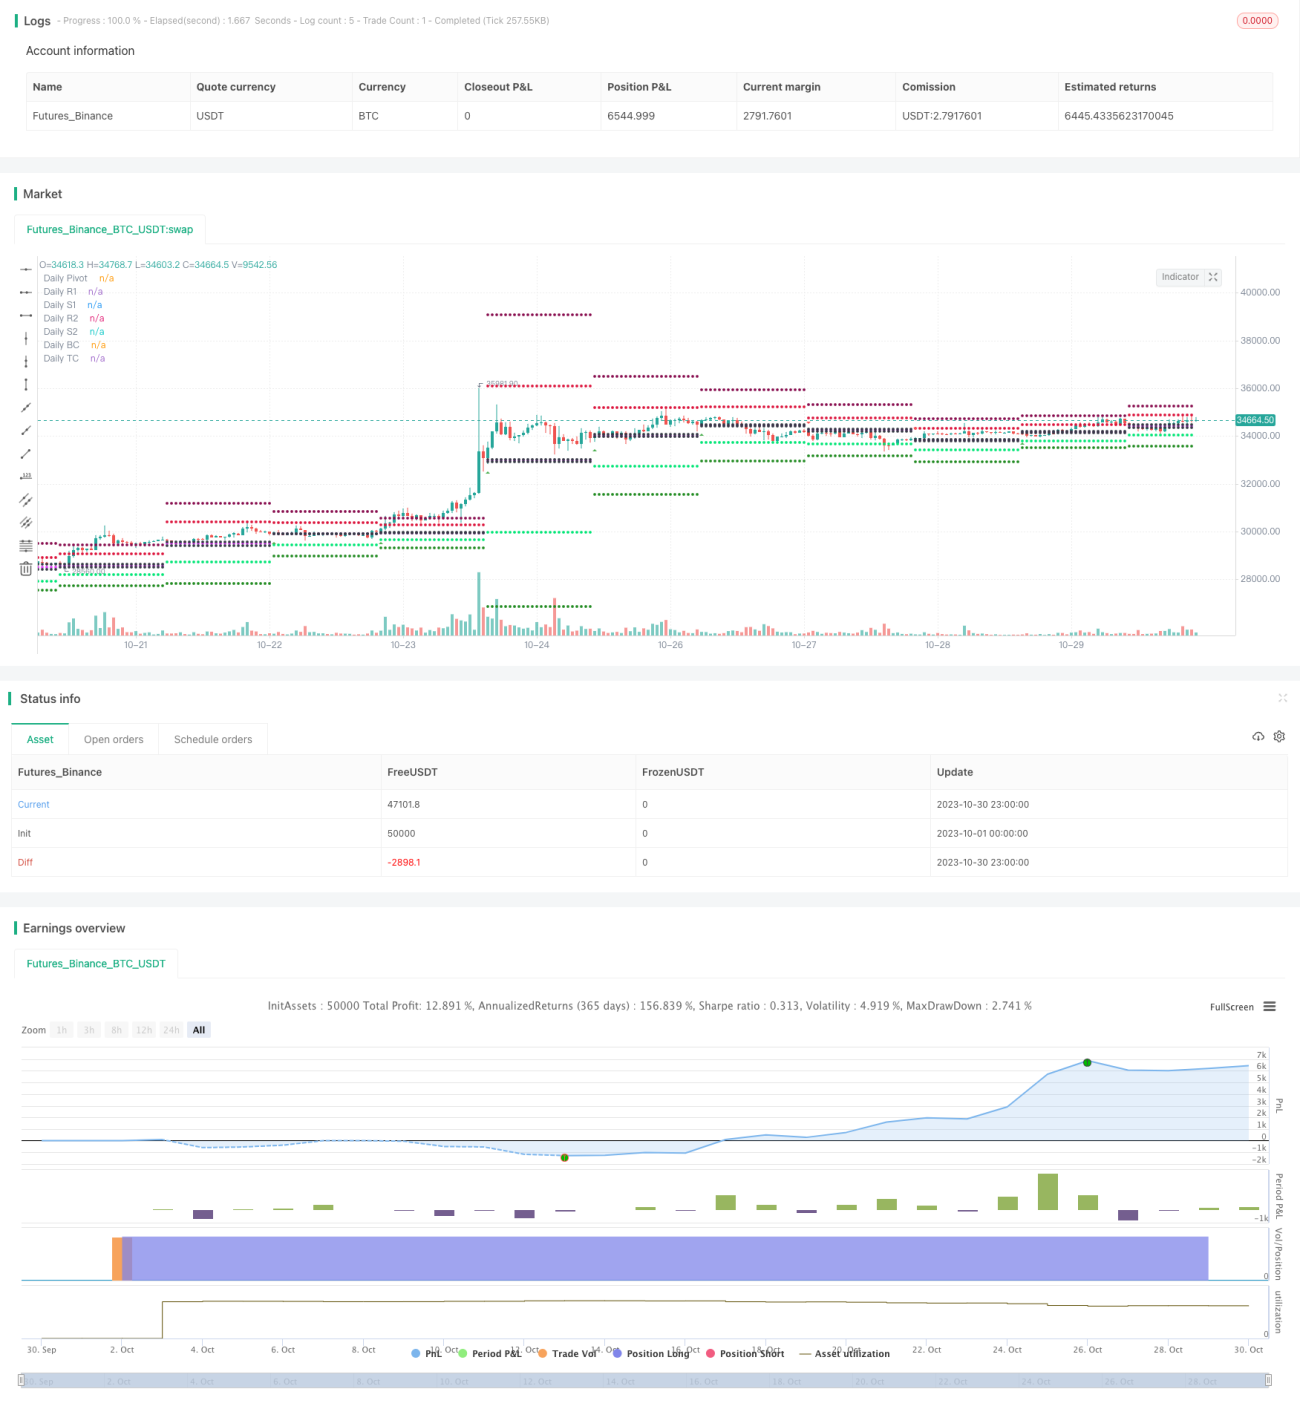
This strategy tracks dual trends of stocks by calculating classic Pivot Points and using RSI indicator to determine current trend direction. It is suitable for medium-term trend trading.
Strategy Principles
The strategy mainly follows these steps to achieve dual trend tracking:
-
Calculate classic Pivot Points including Pivot, S1, R1, S2, R2 etc.
-
Use RSI indicator to determine price trend direction. RSI above 80 is overbought zone and below 20 is oversold zone.
-
Judge daily trend direction. If close price is greater than previous day's R2, it's a strong trend. If close price is less than previous day's S2, it's a weak trend.
-
Make today's trading decisions based on daily trend direction, combining Pivot Points and RSI indicator.
-
If daily trend is strong (close > R2), look for pullback buy points under Pivot or buy below S1.
-
If daily trend is weak (close < S2), look for pullback sell points above Pivot or sell above R1.
-
-
Set stop loss points. For strong trend, stop loss is previous day's S1. For weak trend, stop loss is previous day's R1.
The strategy judges mid-long term trend with Pivot Points, and uses RSI etc to determine short-term trend and entry points. This allows dual-trend tracking of prices, suitable for medium-term trading.
Advantage Analysis
The main advantages of this strategy are:
-
Able to track both mid-long term trend and short-term trend, adapting flexibly to market changes.
-
Pivot Points have some trend-judging capability and can effectively determine mid-long term trend.
-
RSI etc can judge short-term overbought/oversold levels, assisting in determining specific entry points.
-
Strategy rules are clear and simple, easy to grasp.
-
Risk control is in place with clear stop loss points.
Risk Analysis
The main risks of this strategy are:
-
Pivot Points may fail in predicting mid-long term trend. This can be improved by adjusting parameters or combining with other indicators.
-
RSI etc may give false signals. Parameters can be adjusted or used together with other indicators.
-
Stop loss points may be too arbitrary, unable to completely avoid stop loss being hit. Buffer zones can be added.
-
Strategy drawdown may be larger, need psychological preparation and sufficient capital support.
-
Risk of over-trading exists. Opening conditions can be adjusted to avoid over-trading.
Optimization Directions
The strategy can be optimized in these areas:
-
Try different parameter combinations like adjusting RSI parameters, optimizing Pivot Point calculations etc to find optimal parameters.
-
Add or combine other indicators like KDJ, MACD etc to make signals more accurate and reliable.
-
Optimize stop loss strategies eg trailing stop loss, exit stop loss etc to reduce risk of stop loss being hit.
-
Optimize position sizing to limit impact of single position losses.
-
Optimize entry conditions to avoid over-trading. Filters can be added.
-
Test effectiveness across different products and adjust parameters.
-
Add auto take profit strategies to lock in profits.
Summary
This strategy judges mid-long term trend with Pivot Points and uses RSI etc to assist in determining short-term trend and entry points, achieving dual-trend tracking of prices. The overall logic is clear and reasonable, working well for medium-term trading. But some risk of false signals exists, necessitating further optimization of parameters, strict stop loss control to reduce risks, and appropriate position sizing control to manage possible larger drawdowns. With continuous optimization and improvements, stable investment returns can be achieved.
/*backtest
start: 2023-10-01 00:00:00
end: 2023-10-31 00:00:00
period: 1h
basePeriod: 15m
exchanges: [{"eid":"Futures_Binance","currency":"BTC_USDT"}]
*/

//@version=2
strategy(title="swing trade", shorttitle="vinay_swing", overlay=true)
pf = input(false,title="Show Filtered Pivots")
sd = input(true, title="Show Daily Pivots?")- 1