Golden Cross Trend Following Strategy

Overview
This strategy generates trading signals based on the golden cross of short-term and long-term moving averages to determine entry points, and sets stop loss points to exit positions. It is a typical trend following strategy. It is suitable for markets with obvious upward trends, allowing it to follow the trend and profit from upward momentum, and exit promptly when the trend reverses.
Strategy Logic
The strategy mainly uses the crossover of short-term and long-term moving averages to determine market trend. The logic is as follows:
-
Calculate 3-day simple moving average short_ma as the short-term moving average.
-
Calculate 19-day simple moving average long_ma as the long-term moving average.
-
When short_ma crosses above long_ma, a long signal is generated.
-
When price rises above entry price * (1 + stop loss %), close all positions.
-
When short_ma crosses below long_ma, a short signal is generated.
-
Backtest within a specific date range to limit the strategy's operation period.
-
Trade only when the 100-day moving average trend_ma suggests an upward trend.
The strategy utilizes the golden cross of moving averages. During a sustained uptrend, long signals generated when short_ma crosses above long_ma allow it to capture opportunities. Short signals when short_ma crosses below long_ma help manage risks.
Advantage Analysis
The advantages of this strategy:
-
Simple and easy to understand logic based on moving average crossovers.
-
Clear entry and exit rules that follow the trend and manage risks.
-
Stop loss to lock in profits when trend reverses.
-
Only trade when overall trend is up to avoid false signals.
-
Customizable moving average periods adaptable to different markets.
-
Backtest over specific periods allows validation.
Risk Analysis
The risks of this strategy:
-
Sensitive to parameter tuning, different settings affect performance.
-
Curve fitted to historical data, ineffective in anomalies.
-
Unable to handle price gaps, risks exceeding stop loss.
-
Prone to being whipsawed in ranging markets.
-
Only works in obvious trending markets, not for sideways.
-
Backtest period selection influences results.
Enhancement Opportunities
The strategy can be improved in the following aspects:
-
Test different parameter sets to find optimum values.
-
Incorporate other indicators like MACD, Bollinger Bands to improve decisions.
-
Use dynamic trailing stop loss to better control risks.
-
Optimize entry, exit logic, like breakout entry.
-
Test robustness across different market conditions.
-
Explore machine learning for parameter tuning and signal generation.
-
Add handling of price gaps and stop loss whipsaw scenarios.
Conclusion
This simple and effective strategy captures uptrends using moving average crosses and manages risk via stop loss. It performs well in strong trending markets but has limitations. Further optimization and testing is needed to improve robustness. Overall it has clear logic, is easy to understand and implement, suitable for beginners to learn.
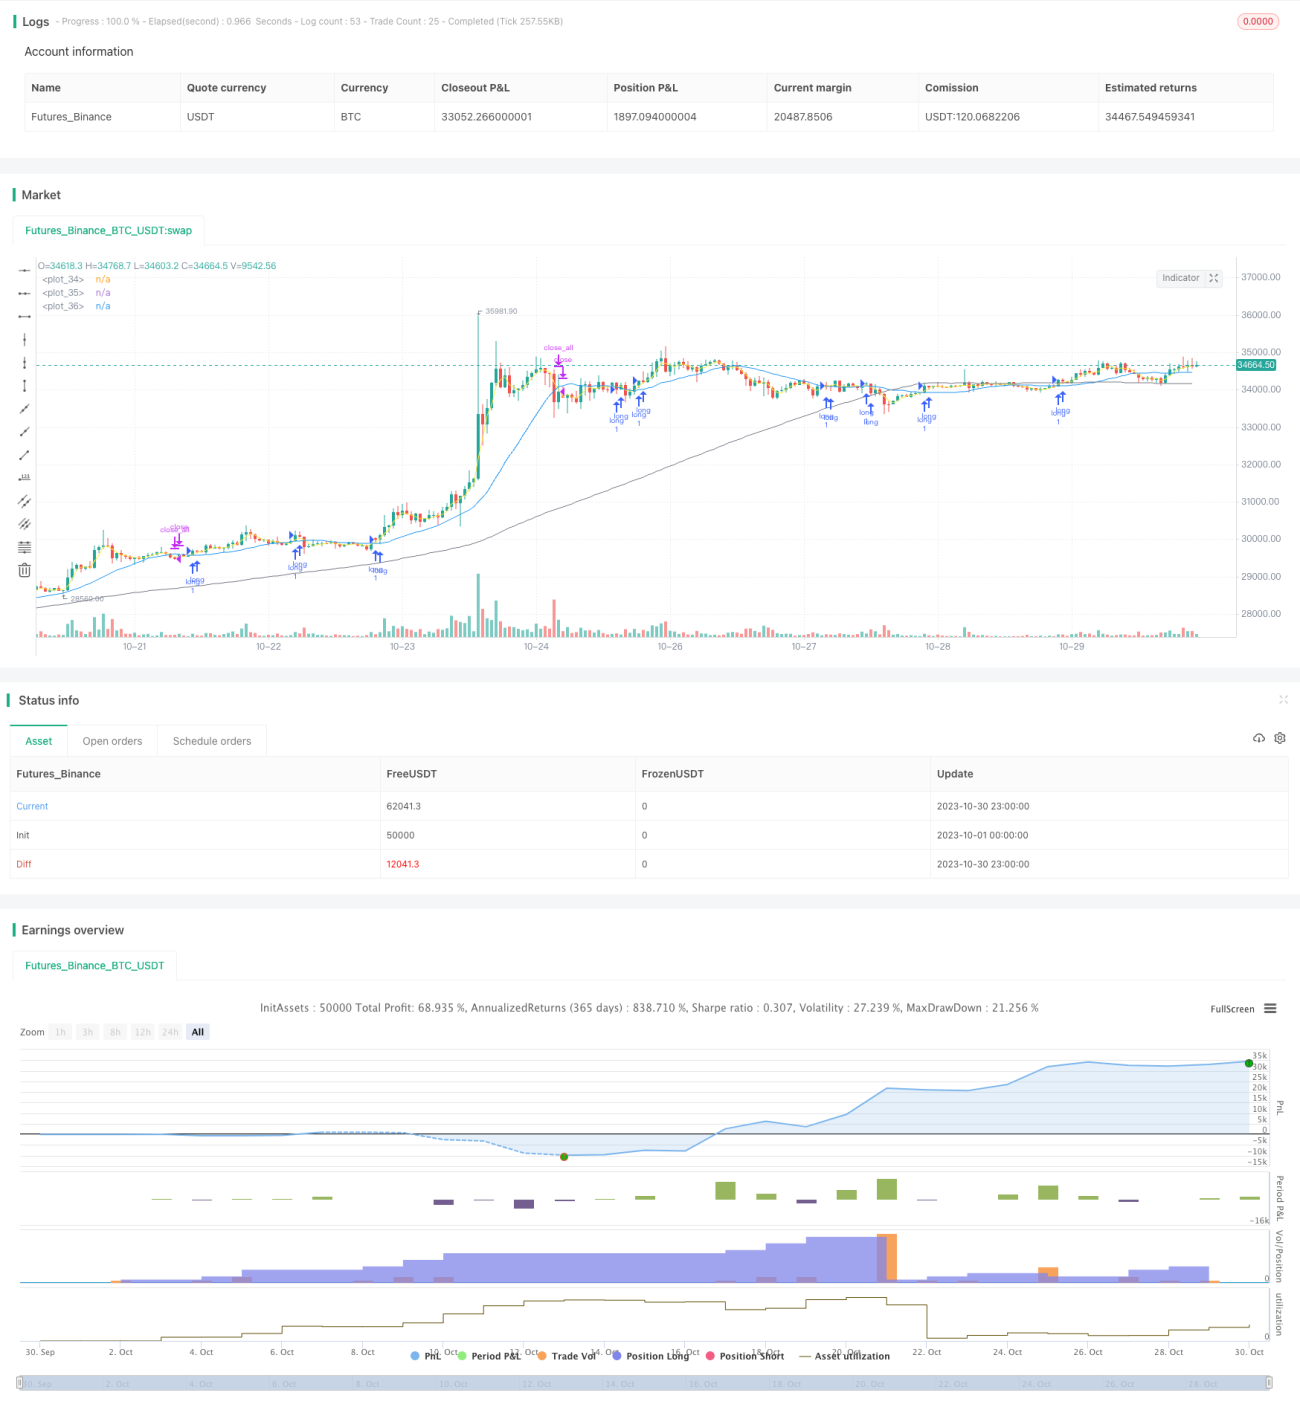
/*backtest
start: 2023-10-01 00:00:00
end: 2023-10-31 00:00:00
period: 1h
basePeriod: 15m
exchanges: [{"eid":"Futures_Binance","currency":"BTC_USDT"}]
*/

// This source code is subject to the terms of the Mozilla Public License 2.0 at https://mozilla.org/MPL/2.0/
// © Ta3MooChi
//@version=5
strategy("전략", overlay=true,process_orders_on_close = true, pyramiding = 100)- 1