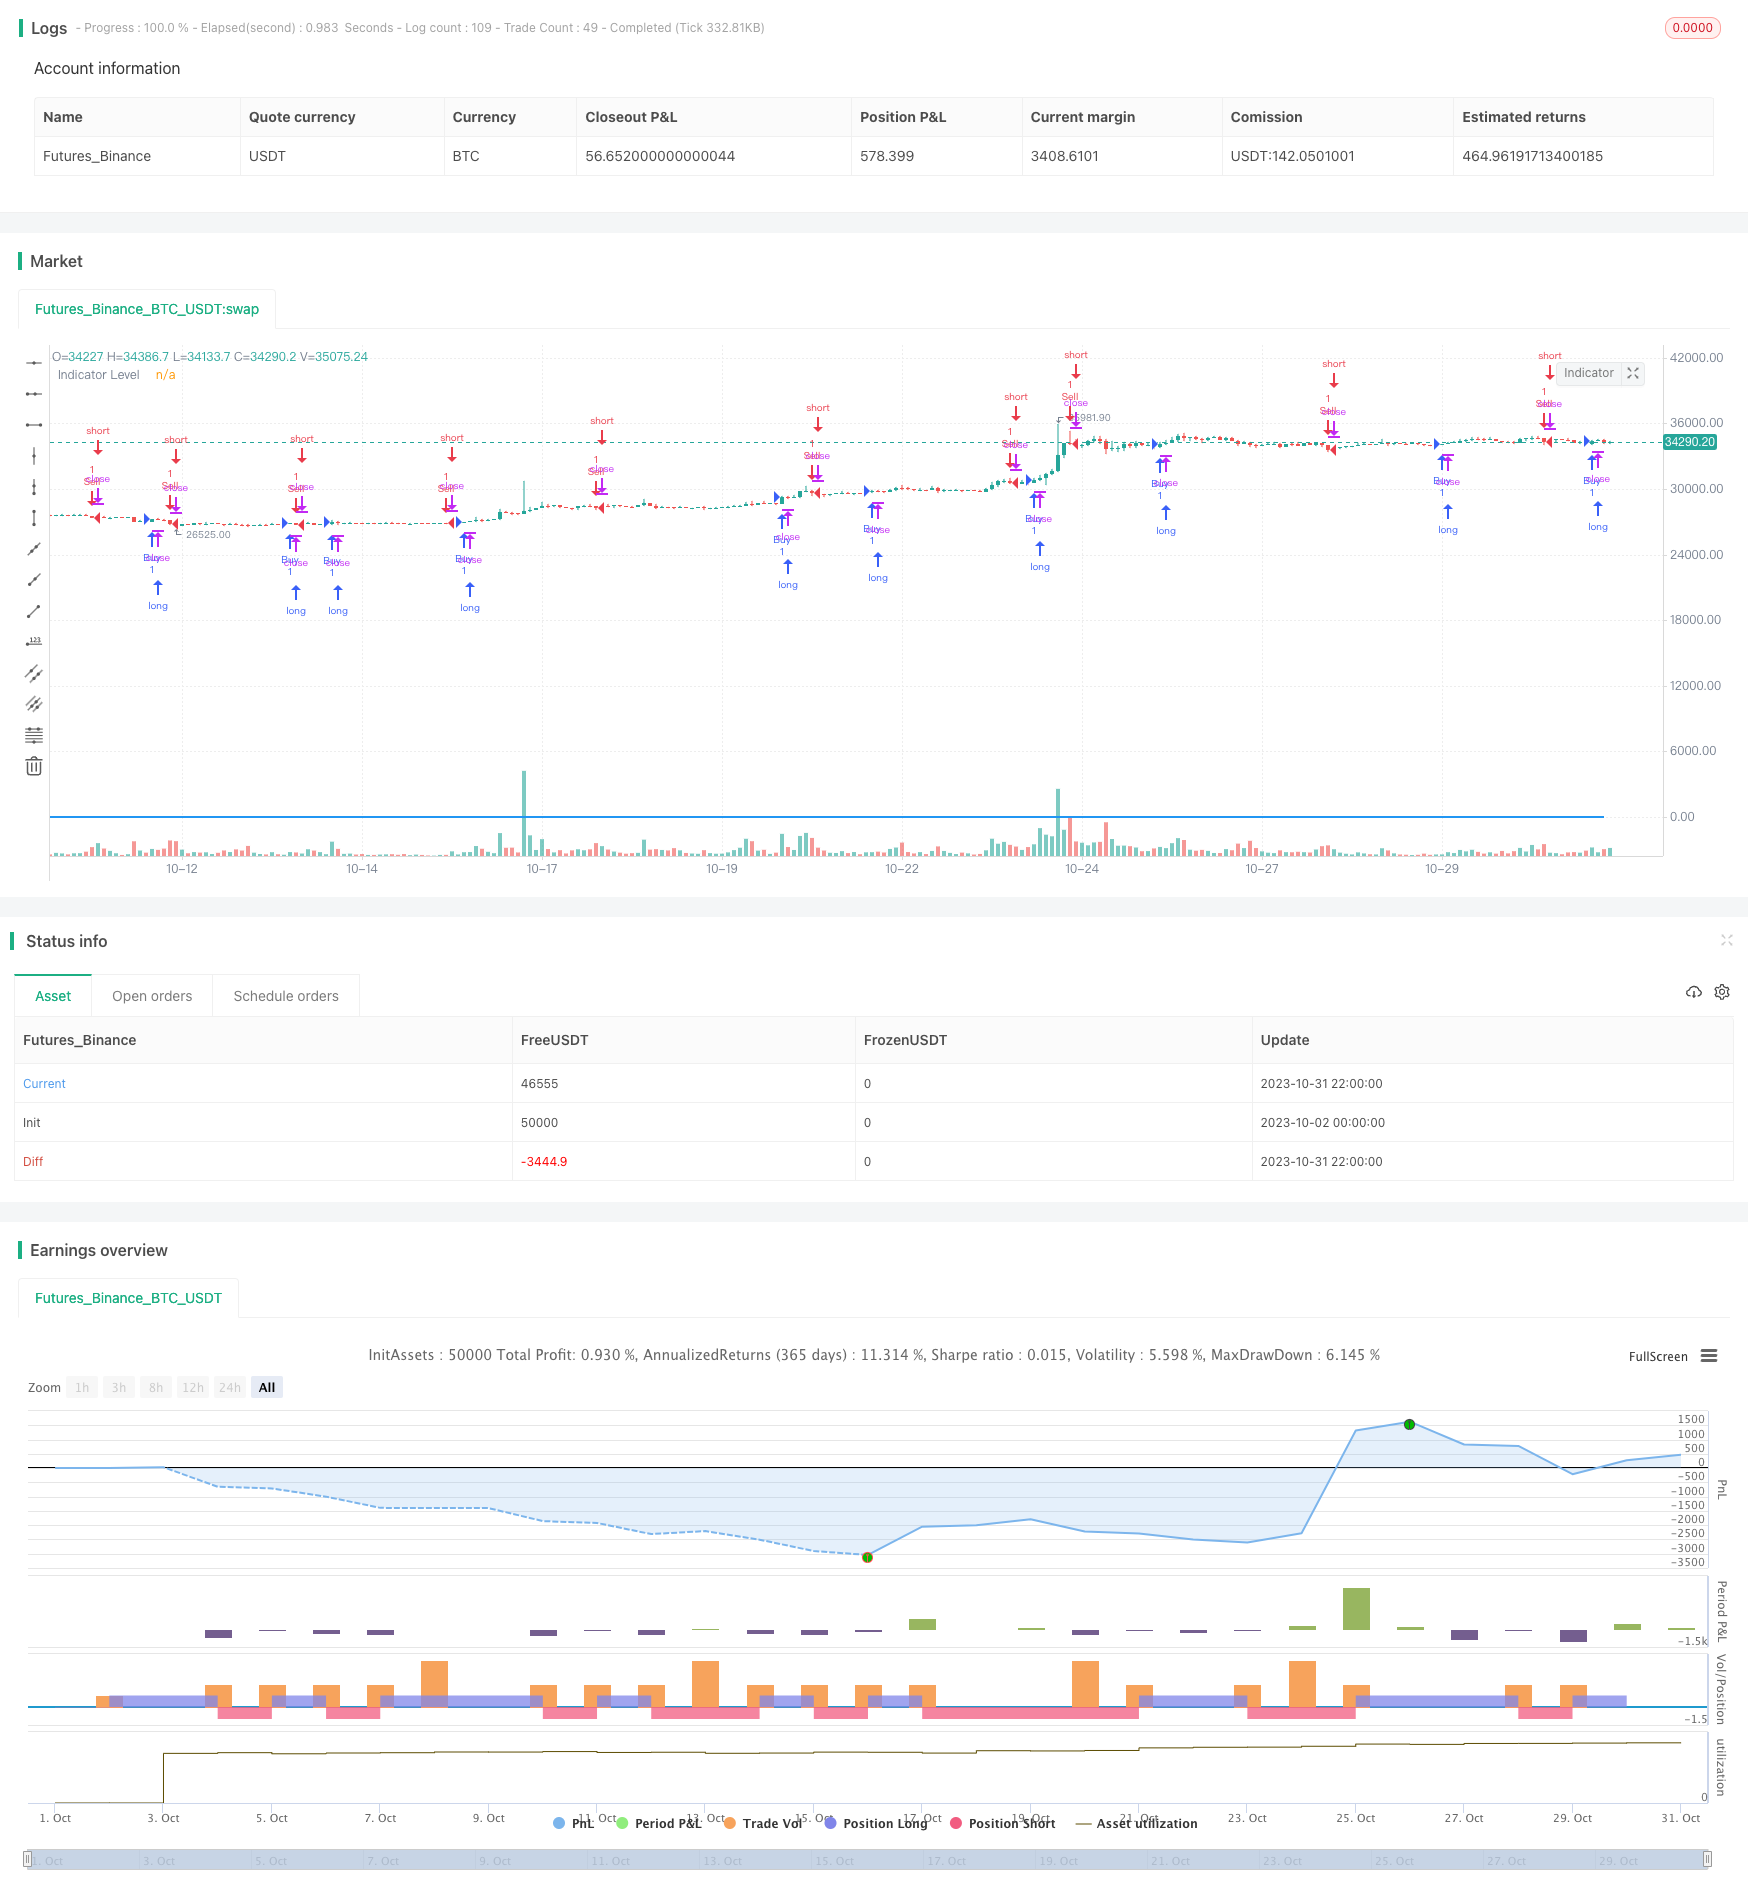
概述
本策略结合了StochRSI指标和交易量,在StochRSI指标发出买入或卖出信号时,同时判断交易量是否大于过去7天的平均交易量。只有当指标信号和交易量条件同时满足时,才会进行买入或卖出操作。该策略旨在利用StochRSI指标判断超买超卖状态,同时用交易量过滤假信号,在高交易量的状况下寻找买入和卖出机会。
策略原理
首先,该策略计算14天RSI的值,然后在RSI上应用14天Stochastic指标,得到StochRSI的K值和D值。StochRSI指标在超买超卖区域发出信号。
然后,计算K值和D值的差值,当差值大于0时,指标水平设为1,小于0时设为-1。指标水平用于判断StochRSI的多空状态。
接着,计算过去7天的平均交易量。当K值上穿D值时(指标水平从负变正),并且收盘价高于开盘价,交易量大于平均量时,认为是买入信号。当K值下穿D值时(指标水平从正变负),并且收盘价低于开盘价,交易量大于平均量时,认为是卖出信号。
所以,该策略结合了StochRSI指标判断市场超买超卖状态,以及交易量来过滤假信号,在真实强势的行情中进行交易。
优势分析
StochRSI指标可以识别超买超卖状态,利用反转交易机会。结合交易量过滤可以避免在盘整区域出现的假信号。
交易量条件可以过滤低量的假突破。只在高交易量的趋势行情中交易,可以提高获利概率。
K值和D值均线交叉以及交易量条件组合,可以提高信号的可靠性,过滤假信号。
策略操作逻辑清晰简单,容易理解实现,适合用于量化交易。
风险分析
StochRSI指标存在时序问题,K值和D值交叉信号可能滞后,可能导致入场过早或过晚。需要优化参数以提高指标敏感性。
交易量放大效应可能导致策略在市场崩盘大跌时遭受重大损失。需要设置止损来控制风险。
只依靠StochRSI指标易受到假突破的影响,需要进一步优化,增加其他条件判断。
交易量 FILTER 可能会错过一些交易机会。可以结合成交笔、笔力分析进一步优化。
优化方向
优化StochRSI参数,寻找最佳K值、D值参数组合,提高指标的灵敏度。
增加成交量的均线指标,判断成交量趋势,避免交易量下跌期间的假信号。
增加其他指标,例如MACD,RSI等进行组合,提高信号的准确性。
增加止损策略,根据ATR等指标设置动态止损,控制单笔损失。
进行反向和同向交易量分析,避免同向交易量带来过度放大的风险。
根据市场阶段采用不同的参数,优化StochRSI的参数,使之更具有适应性。
总结
本策略首先利用StochRSI判断超买超卖状态,以及K值和D值的交叉来发出交易信号。同时,结合交易量指标来过滤假信号,只在真实强势行情中进行买入和卖出。该策略集成简单的指标,形成了易于实现的量化交易策略。通过进一步的测试和优化,可以提高策略的稳定性和盈利能力。但是也需要警惕交易量放大风险,建议增加止损来控制风险。
/*backtest
start: 2023-10-02 00:00:00
end: 2023-11-01 00:00:00
period: 2h
basePeriod: 15m
exchanges: [{"eid":"Futures_Binance","currency":"BTC_USDT"}]
*/

//@version=5
strategy("StochRSI Volume Strategy", overlay = true)

// StochRSI inputs
smoothK = input.int(3, title="K")
smoothD = input.int(3, title="D")
lengthRSI = input.int(14, "RSI Length")
lengthStoch = input.int(14, "Stochastic Length")

// Calculate StochRSI
rsiValue = ta.rsi(close, lengthRSI)
k = ta.sma(ta.stoch(rsiValue, rsiValue, rsiValue, lengthStoch), smoothK)
d = ta.sma(k, smoothD)

// Calculate difference between lines
lineDifference = k - d

// Calculate indicator level based on line positions
level = lineDifference >= 0 ? 1 : -1

// Calculate mean of last 7 volume bars
meanVolume = ta.sma(volume, 7)

// Determine buy and sell conditions
buyCondition = level > -1 and level[1] <= -1 and close > open and volume > meanVolume
sellCondition = level < 1 and level[1] >= 1 and close < open and volume > meanVolume

// Execute buy and sell signals
strategy.entry("Buy", strategy.long, when = buyCondition)
strategy.entry("Sell", strategy.short, when = sellCondition)

// Plot StochRSI levels
plot(level, title="Indicator Level", color=color.blue, linewidth=2)