Triple Moving Average Trading Strategy

Overview
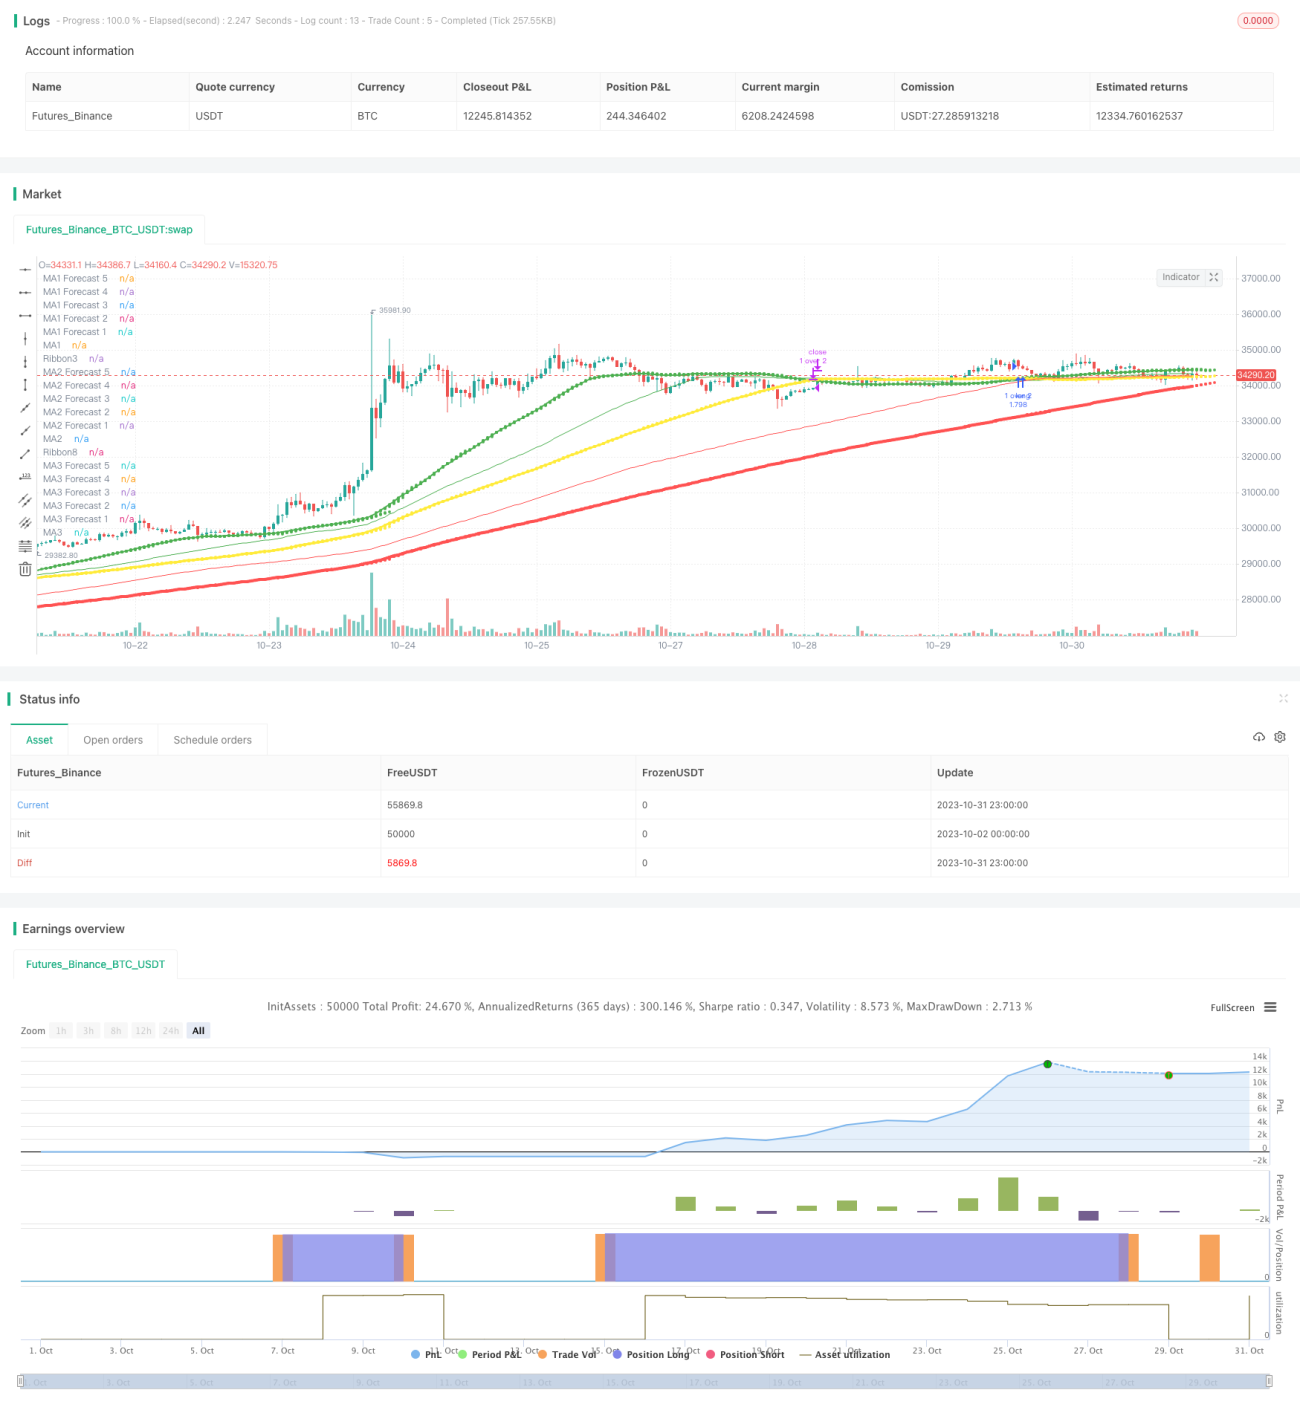
This strategy is a trend-following trading strategy based on three moving averages. It uses three moving averages with different periods for long and short decisions, which is a typical trend tracking strategy.
Strategy Logic
-
The strategy uses 3 moving averages: MA1, MA2 and MA3. The periods of the 3 moving averages are set by the user, generally MA1 < MA2 < MA3, for example, MA1 is 50 periods, MA2 is 100 periods, and MA3 is 200 periods.
-
The strategy mainly references MA1 for trading decisions. When the short period MA1 crosses over the long period MA2 or MA3, go long; when MA1 crosses below MA2 or MA3, go short.
-
The strategy can choose to trade only the crossover of MA1 and MA2, or only the crossover of MA1 and MA3, or trade both crossovers.
-
When a crossover signal occurs, open a position using market order. The take profit and stop loss are set as a certain percentage of the close price, such as 30% take profit and 15% stop loss.
-
For optimization, the periods of the MA lines can be adjusted, the percentages of take profit and stop loss can be tuned, other indicators can be added to filter the signals, etc.
Advantage Analysis
-
Using multiple moving averages for decision making can effectively filter false breakouts.
-
Adopting MA combinations with different periods can dynamically adjust positions in the trend and achieve trend tracking.
-
It is flexible to only trade Golden Cross, or only Death Cross, or both, with diverse trading methods.
-
The stop loss mechanism can effectively control single loss.
Risk Analysis
-
As a trend tracking strategy, it is prone to stop loss in range-bound markets.
-
If MA periods are improperly set, it may lead to frequent trading and lower win rate.
-
If failed to cut loss in time after failed breakout, it may lead to large loss.
-
If take profit and stop loss settings are too loose, single profit or loss may be too large.
Optimization Directions
-
Optimize the parameters of MA to find the best parameter combination.
-
Add other indicators to filter the entry timing, such as MACD, KDJ etc.
-
Optimize take profit and stop loss points to improve profit-risk ratio of the strategy.
-
Add position sizing like fixed quantity per order or money management.
-
Add stop loss offset for breakouts to optimize the stop loss strategy.
Summary
In general this is a typical trend-following strategy by judging the crossover of multiple MA lines. It is a relatively stable trend tracking strategy. Further improvements can be made through parameter tuning, indicator filtering, position sizing etc. But the core idea is simple and clear, suitable for beginners to learn and practice. If parameters are properly optimized, it can achieve steady profits in strong trending markets.
- 1