概述
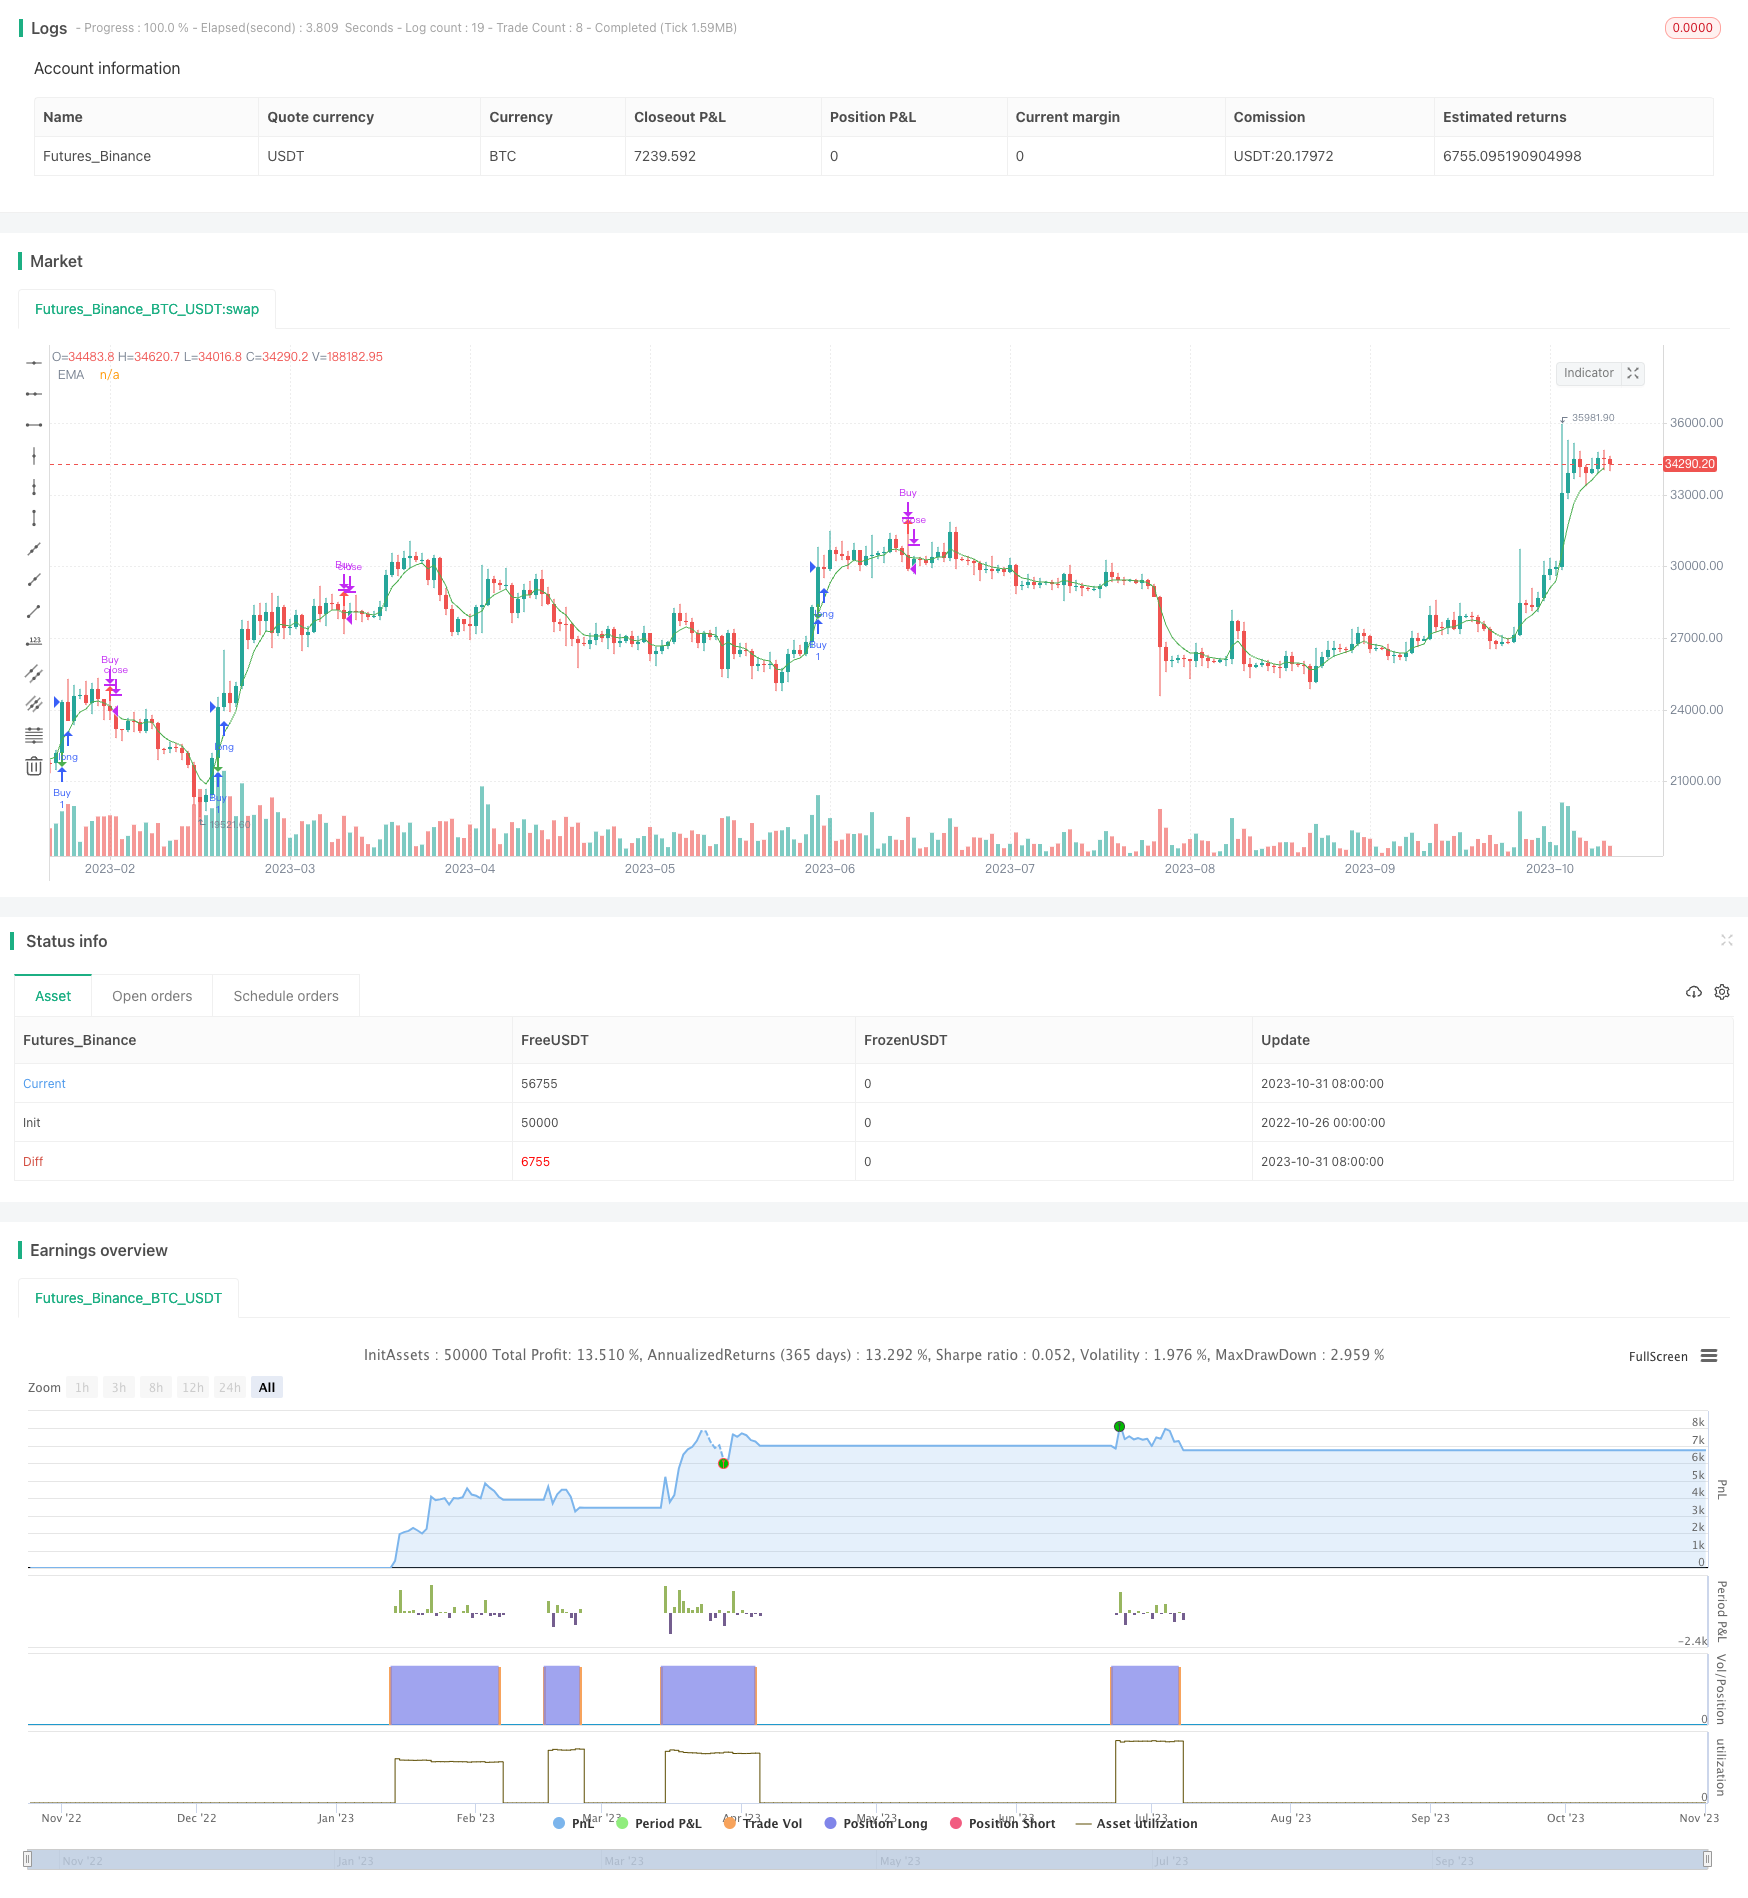
动量跨市高效盈利策略是一种定量交易策略,旨在通过整合跨市交易原理和动量指标,来捕捉中期金融市场中的盈利机会。该策略利用移动平均线、穿越信号以及交易量分析等多种技术指标的组合来生成买入和卖出信号。策略的目标是识别市场趋势,抓住价格动量带来的盈利。
策略原理
买入信号的判断依据多个因素综合考虑,主要包括A1、A2、A3、XG和weeklySlope。具体来看:
A1条件:检查特定的价格关系,验证最高价与收盘价之比小于1.03,开盘价与最低价之比小于1.03,最高价与前一日收盘价之比大于1.06。该条件寻找特定模式,表示潜在的多头动量。
A2条件:检查与收盘价相关的价格关系,验证收盘价与开盘价之比大于1.05,或收盘价与前一日收盘价之比大于1.05。该条件寻找上涨价格运动和动量的迹象。
A3条件:关注交易量,检查当前交易量是否突破过去60周期内的最高交易量。该条件旨在识别买盘增加和确认潜在上涨动力强劲。
XG条件:结合A1和A2条件,检查当前K线及前一K线是否同时满足。另外验证收盘价与5周期EMA的比值是否突破同比值的9周期SMA。该条件有助于识别多个因素同时提示的买入信号。
周线趋势因子:计算50周期SMA在周线图上的斜率,检查斜率是否为正,表示整体处于周线上升趋势。该条件提供额外确认股票整体处于上升通道。
当这些条件同时满足时,触发买入条件,提示该时点进入做多头寸可能获得超额收益的良机。
卖出条件比较简单,仅检查收盘价是否下破10周期EMA。该条件提示反转或多头势头减弱的信号。
策略优势
- 整合跨市交易和动量指标,融合不同策略思想
- 优化多种技术指标的组合使用,识别高概率交易机会
- 采用头寸规模控制和止盈止损技术进行风险管理
- 回测表现良好,具有可观的净利润和胜率
策略风险
- 多头行情占优势时效果好,空头行情无法适应
- 假突破可能导致错误交易
- 头寸规模和止盈止损设置不当可能扩大损失
- 需适当调整参数以针对不同市场环境
策略优化
- 增加过滤指标,提高信号质量
- 优化止损方式,如追踪止损等
- 动态调整头寸规模
- 结合机器学习提高参数优化效果
总结
动量跨市高效盈利策略综合运用跨市交易思想和动量指标,通过参数优化,todolist整合判断条件,实现了在回测中取得可观收益的定量交易策略。该策略较好抓取中期价格趋势,但需警惕趋势反转的风险。通过进一步优化,有望进一步提升策略稳定性和实盘表现。
/*backtest
start: 2022-10-26 00:00:00
end: 2023-11-01 00:00:00
period: 1d
basePeriod: 1h
exchanges: [{"eid":"Futures_Binance","currency":"BTC_USDT"}]
*/

// This source code is subject to the terms of the Mozilla Public License 2.0 at https://mozilla.org/MPL/2.0/
// © fzj20020403
//@version=5
strategy("Slight Swing Momentum Strategy.", overlay=true)

// Position Status Definition
var inPosition = false

// Moving Average Definition
ma60 = ta.sma(close, 60)

// A1 Condition Definition
A1 = high / close < 1.03 and open / low < 1.03 and high / close[1] > 1.06

// A2 Condition Definition
A2 = close / open > 1.05 or close / close[1] > 1.05

// A3 Condition Definition
highestVol = ta.highest(volume, 60)
A3 = ta.crossover(volume, highestVol[1])

// B1 Condition Definition
ema5 = ta.ema(close, 5)
B1 = close / ema5

// XG Condition Definition
A1andA2 = (A1 and A2) and (A1[1] and A2[1])
XG = ta.crossover(B1, ta.sma(B1, 9))

// Weekly Trend Factor Definition
weeklyMa = ta.sma(close, 50)
weeklySlope = (weeklyMa - weeklyMa[4]) / 4 > 0

// Buy Signal using XG Condition
buySignal = A1 and close > ma60 or A2 and A3 and XG and close > ma60 and weeklySlope

// Sell Signal Condition
sellSignal = close < ta.ema(close, 10)

// Buy and Sell Conditions
buyCondition = buySignal and not inPosition
sellCondition = sellSignal and inPosition

// Execute Buy and Sell Operations
if (buyCondition)
    strategy.entry("Buy", strategy.long)
    inPosition := true
if (sellCondition)
    strategy.close("Buy")
    inPosition := false

// Stop Loss and Take Profit Levels
stopLoss = strategy.position_avg_price * 0.5
takeProfit = strategy.position_avg_price * 1.30

// Apply Stop Loss and Take Profit Levels
if inPosition
    strategy.exit("Long Stop Loss", "Buy", stop=stopLoss)
    strategy.exit("Long Take Profit", "Buy", limit=takeProfit)

// Plot Buy and Sell Signal Shapes
plotshape(buyCondition, style=shape.arrowdown, location=location.belowbar, color=color.green, size=size.small)
plotshape(sellCondition, style=shape.arrowup, location=location.abovebar, color=color.red, size=size.small)

// EMA Variable Definition
ema = ta.ema(close, 5)

// Plot Indicator Line
plot(ema, color=color.green, title="EMA")