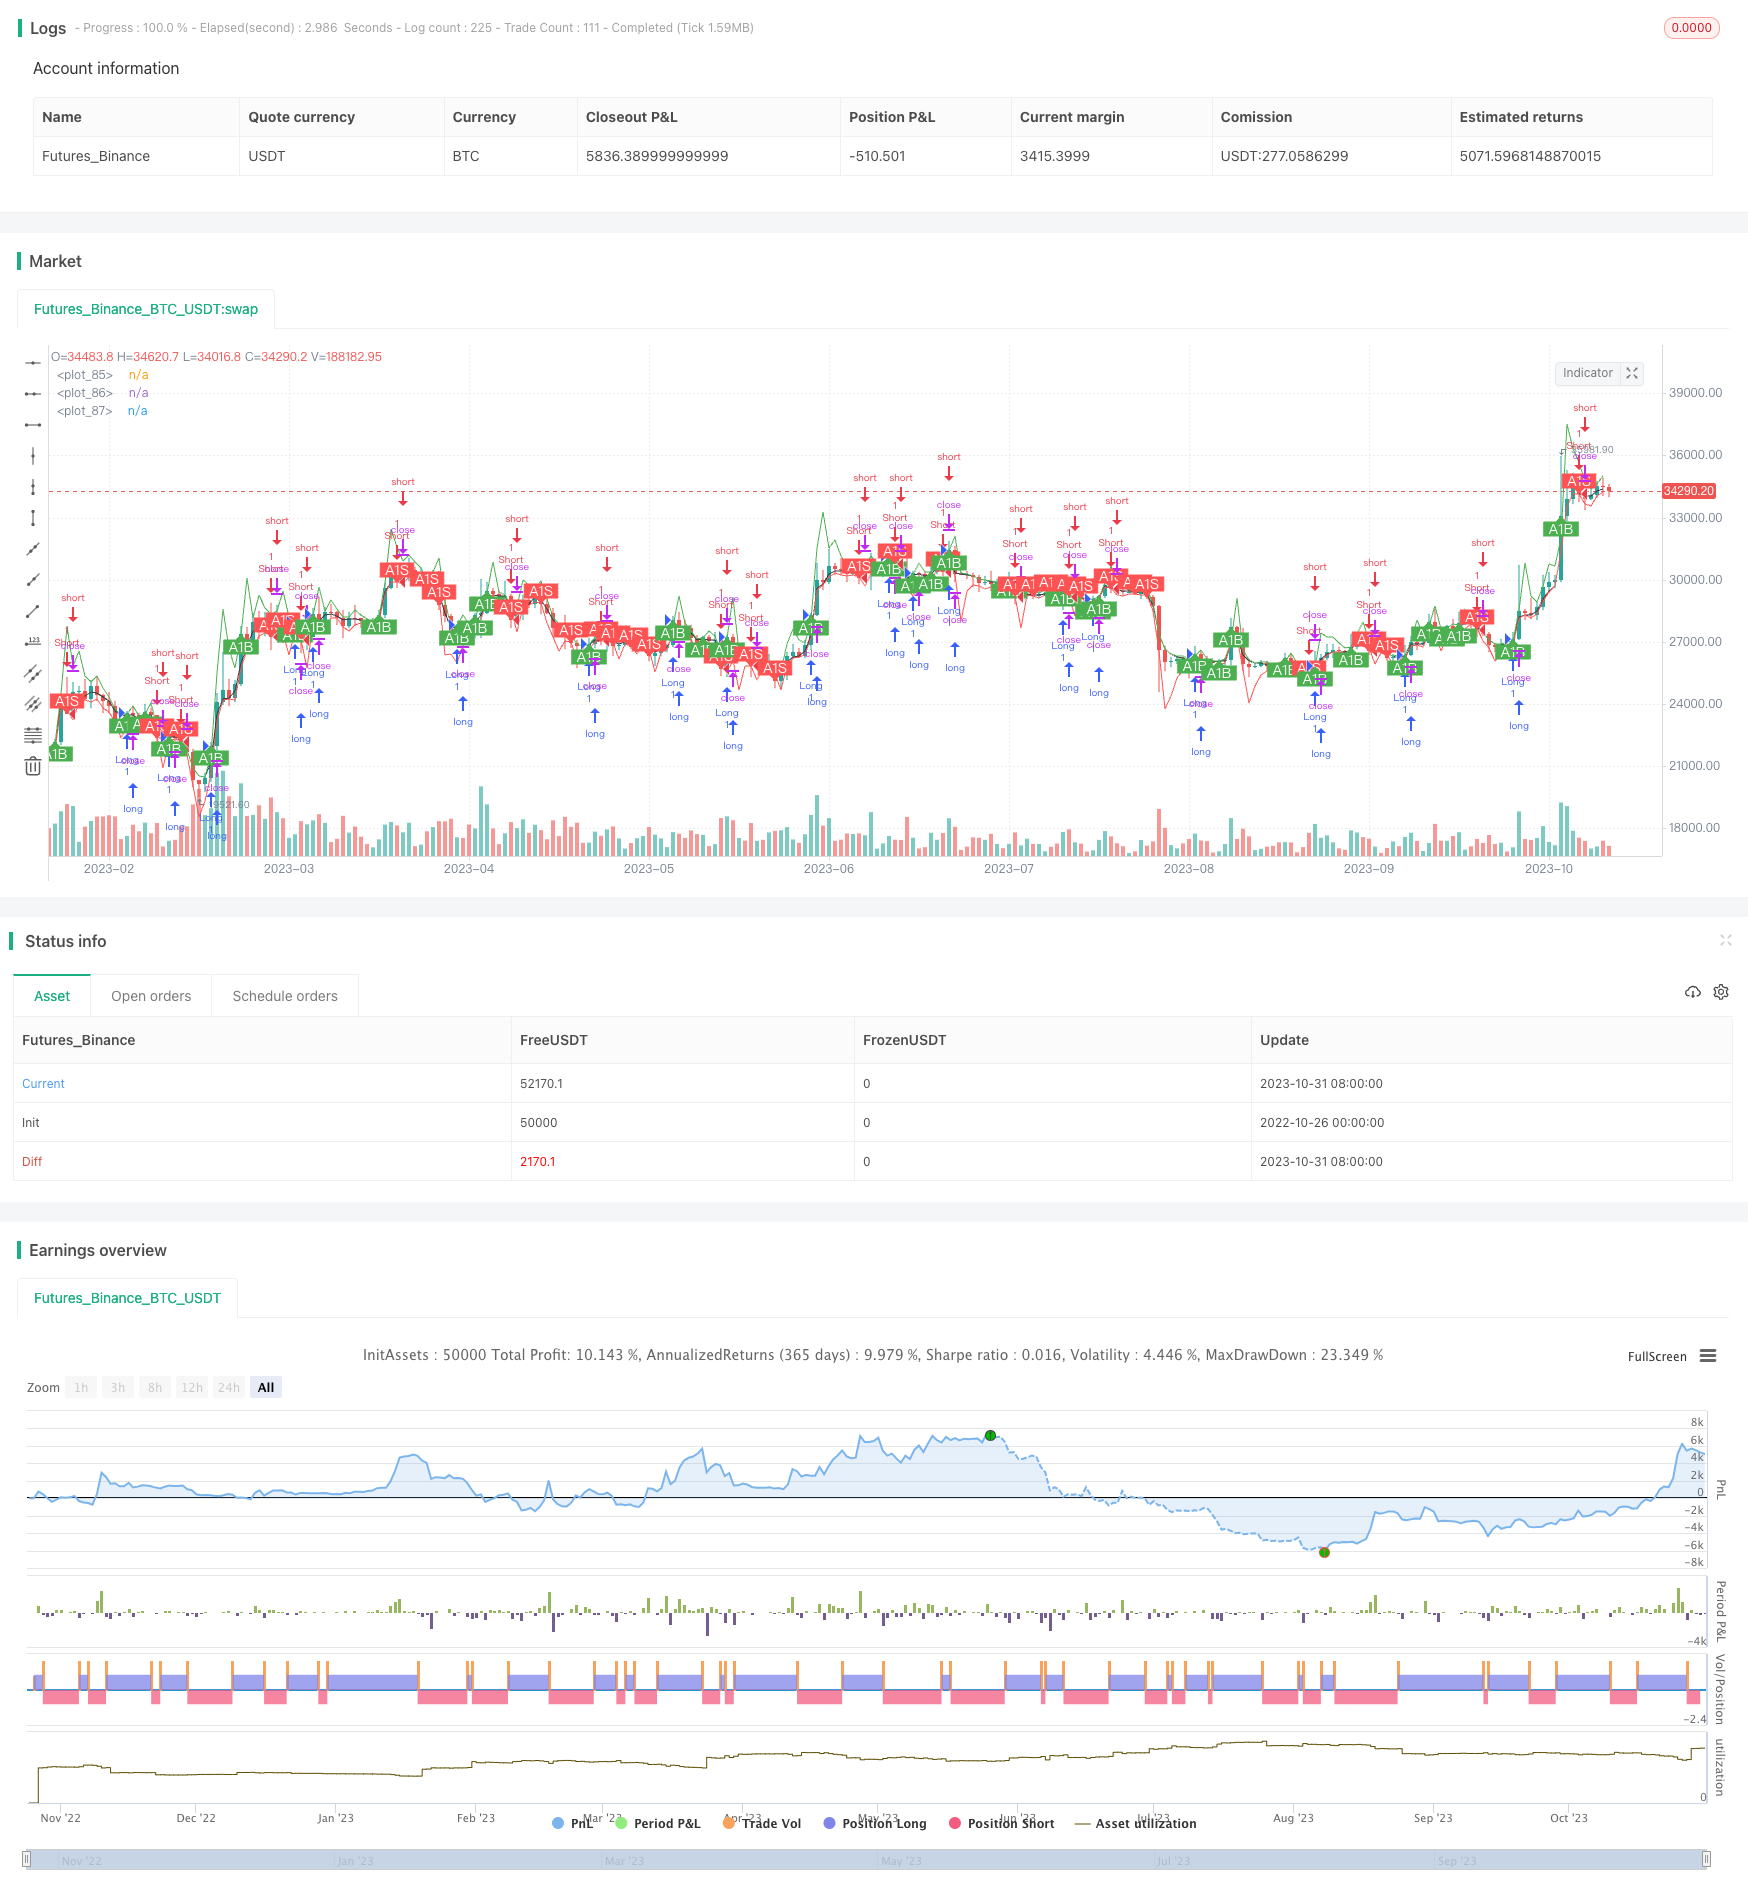
概述[Overview]
均自适应通道价格突破策略是基于均自适应移动平均线(AMA)和自适应通道范围来进行买卖信号判断的长线突破策略。该策略利用AMA计算当前价格的趋势方向,并结合动态调整的通道范围来发现价格突破信号,从而进行适时买入和卖出。
策略原理[Strategy Principle]
该策略的核心指标是均自适应移动平均线(AMA),用于捕捉价格趋势。AMA的计算公式为:
AMA(t) = α(t-1) * P(t) + [1 - α(t-1)] * AMA(t-1)
其中,P(t)为当期价格,α(t)为平滑常数,其值范围在0到1之间。α(t)由一定规则动态调整,用以控制AMA对价格变化的敏感程度。具体来说,α(t)的值与AMA和价格的偏差幅度SNRT成正比,SNRT计算公式如下:
SNRT = (P(t) - AMA(t-1)) / AMA(t-1)
这样,当价格波动加大时,α(t)将增大,使得AMA更敏感地跟随价格;当价格波动减小时,α(t)将减小,使得AMA有更高的平滑性。
基于AMA,策略再建立自适应通道范围,用于发现价格突破信号。通道范围的上下轨分别为:
上轨:H(t) = (1 + β*H(t-1)) * AMA(t)
下轨:L(t) = (1 - β*L(t-1)) * AMA(t)
其中β为可调参数,控制通道宽度。最后,策略通过观察价格是否突破上下轨来产生交易信号:
当价格上穿上轨时,做多;
当价格下穿下轨时,做空;
否则为空仓。
优势分析[Advantage Analysis]
该策略具有以下优势:
使用AMA而不是普通移动平均线,可以更灵活地捕捉价格趋势,尤其适用于波动较大的市场。
自适应通道范围可以动态调整,在行情不确定时扩大通道宽度,在明确趋势时收窄通道追踪价格。
采用价格突破交易信号,可以在趋势开始阶段及时捕捉,具有较高的胜率。
策略逻辑简单明确,容易理解和实现,适合量化交易。
风险分析[Risk Analysis]
该策略也存在以下风险:
AMA参数设定不当可能导致错失价格趋势或者产生假信号。
自适应通道参数如β需要谨慎设定,否则会出现过多频繁交易或者漏掉趋势。
价格突破信号容易被假突破欺骗,应该结合更多指标进行过滤。
策略本身未考虑资金管理和止损机制,存在一定亏损风险。
优化方向[Optimization Directions]
该策略可以从以下方面进行优化:
优化AMA的α值计算方式,使其对价格变化更敏感。
增加通道突破后的进一步确认,避免假突破产生错误信号。
结合交易量或波动性指标进行过滤,确保突破的有效性。
增加跟踪止损机制,以锁定利润和控制风险。
优化资金管理,确定不同资产合理的仓位管理。
总结[Conclusion]
均自适应通道价格突破策略整体来说是一个简单实用的趋势跟踪突破策略。它通过灵活应用均自适应移动平均线来跟踪价格趋势,并辅以自适应通道发现突破信号。该策略具有一定的优势,但也存在可能的风险。通过对参数优化、增加过滤条件、改进止损机制等方式,可以使策略更稳健可靠。总体来说,该策略为量化交易提供了一个不错的基础模型。
/*backtest
start: 2022-10-26 00:00:00
end: 2023-11-01 00:00:00
period: 1d
basePeriod: 1h
exchanges: [{"eid":"Futures_Binance","currency":"BTC_USDT"}]
*/

//@version=4

// CryptoStatistical - 2019
// AMA Strategy Channel Breakout Strategy from E. Durenard - Professional Automated Trading
// https://www.amazon.com/Professional-Automated-Trading-Theory-Practice/dp/1118129857

strategy(title="[CS] AMA Strategy - Channel Break Out", shorttitle="AMA_ChannelBreakout_Strategy", initial_capital = 1000, overlay=true, pyramiding = 0, calc_on_every_tick=false, calc_on_order_fills=false, commission_type= strategy.commission.percent, commission_value = 0.08, currency=currency.USD)
testStartYear = input(2019, "Backtest Start Year")
testStartMonth = input(6, "Backtest Start Month")
testStartDay = input(1, "Backtest Start Day")
testPeriodStart = timestamp(testStartYear,testStartMonth,testStartDay,0,0)

testStopYear = input(2019, "Backtest Stop Year")
testStopMonth = input(12, "Backtest Stop Month")
testStopDay = input(31, "Backtest Stop Day")
testPeriodStop = timestamp(testStopYear,testStopMonth,testStopDay,0,0)

testPeriodBackground = input(title="Color Background?", type=input.bool, defval=true)
testPeriodBackgroundColor = testPeriodBackground and (time >= testPeriodStart) and (time <= testPeriodStop) ? #00FF00 : na
bgcolor(testPeriodBackgroundColor, transp=95)

testPeriod() =>  true

price = input(title='Price Source:', type=input.source, defval=close)

ama = price
hb = price
lb = price

// Static model parameters
minfactor = 0.
maxfactor = 1.
deviation_max = 1.
deviation_min = 1.
beta_hb = 1.
beta_lb = 1.
snr = 1.

normalized_atan= 0.
alpha = 0.5
// Suggested snr-factor from .5 upto 3.1 by .3 to find best parameter
snrfactor = input(title='SNR Factor:', type=input.float, minval=0.6, maxval=3.3, step=0.3, defval=2.1)

// Sensitivity Lookback search for the best perdiod from 5 to 20
lookback = input(title='Sensitivity Lookback:', type=input.integer, defval=5)

// Suggested Beta from .5 below 4.5 by .3, usually in the range 1.2, 1.5
beta = input(title='Beta:', type=input.float, minval=0.6, maxval=4.5, step=0.3, defval=2.1)

offsetlabel = input(title='Offset Label:', type=input.float, minval=0.001, maxval=0.03, step=0.001, defval=0.001)

// pi/2
pi2 = 1.5707963267948966

// Zero-lag resampled moving average (Durschner nwma)
f_nwma(_src, _period) =>
    fast = _period/2
    lambda = _period/fast
    alpha = lambda * (_period - 1)/(_period - lambda)
    average1 = wma(_src,_period)
    average2 = wma(average1,fast)
    nwma = (1+alpha)*average1 - alpha*average2

ama := alpha[1]*price + (1-alpha[1])*nz(ama[1])

deviation_max := alpha[1]*max((price[0] - price[1])/price[1],0) + (1-alpha[1])*nz(deviation_max[1])
deviation_min := -alpha[1]*min((price[0] - price[1])/price[1],0) + (1-alpha[1])*nz(deviation_min[1])

beta_hb := beta*deviation_max
beta_lb := beta*deviation_min
hb := (1 + beta_hb[1])*ama
lb := (1 - beta_lb[1])*ama

snr := if price > hb
    ((price - ama[1])/ama[1])/beta_lb
else
    if price < lb
        -((price - ama[1])/ama[1])/beta_hb
    else
        0

normalized_atan := (atan(snrfactor*snr) + pi2)/(2*pi2)
alpha := f_nwma(minfactor + (maxfactor - minfactor)*normalized_atan, lookback)

plot(ama, color=color.black)
plot(hb, color=color.green)
plot(lb, color=color.red)

// Buy Condition Var
bc = false
// Sell Condition Var
sc = false
d = color.black

// Buy Condition
if(price > hb)
    bc := true
    d := color.green

// Sell Condition
if(price < lb)
    sc := true
    d := color.red

if(testPeriod())
    strategy.entry("Long", strategy.long, when = bc)
    strategy.entry("Short", strategy.short, when = sc)

alertcondition(bc, title='BuyCondition', message='Buy')
alertcondition(sc, title='SellCondition', message='Sell')

plotshape(title='Buy', series=bc ? price * (1 - offsetlabel) : na, text='A1B', style=shape.labelup, location=location.absolute, color=d, textcolor=color.white, offset=0)
plotshape(title='Sell', series=sc ? price  * (1 + offsetlabel) : na, text='A1S', style=shape.labeldown, location=location.absolute, color=d, textcolor=color.white, offset=0)