Relative Strength Index RSI Strategy

Overview
The RSI strategy is a trading strategy that utilizes the Relative Strength Index (RSI) indicator to generate trade signals. It identifies overbought and oversold conditions in the market by observing extreme RSI values, aiming to capture price reversal opportunities. It goes long when RSI enters oversold territory and goes short when RSI reaches overbought area, expecting prices to revert back to the mean from extremes.
Strategy Logic
The RSI strategy is based on the calculation principle of the RSI indicator. RSI measures the strength of price movements by comparing the average closing price gains and average closing price losses over a period of time. Its formula is:
RSI = 100 - (100 / (1 + RS))
Where RS = Average Closing Price Gains / Average Closing Price Losses over past n days.
According to the formula, RSI value is fixed between 0 and 100. When the security price has been rising consistently, pushing RS higher, RSI will approach 100. When price has been falling persistently, making RS smaller, RSI will go near 0.
The empirical rule followed by the RSI strategy is: when RSI goes below 30, which is considered oversold area, go long; when RSI rises above 70, deemed as overbought zone, go short. By trading back and forth between the two extremes, it aims to capture opportunities of price reverting from one extreme back to the mean.
Specifically, the strategy sets the Length parameter to define the calculation period of RSI, and the Oversold and Overbought parameters to specify the threshold values for RSI oversold/overbought zones. It generates long/short signals by checking the current RSI value against the threshold values. The reverse parameter is also available to control the trade direction.
Advantages
The biggest advantage of the RSI strategy is its simplicity. RSI is a very common technical indicator available in most trading platforms. The strategy directly uses RSI to determine trade signals without complex math or models, which makes it really easy to understand and use.
Another advantage is the flexibility in parameter tuning. The strategy allows customizing RSI period and overbought/oversold threshold values, which helps adapt to changing market conditions. The reverse trade setting also adds flexibility.
The RSI strategy also has a higher win rate. By tracking overbought/oversold extremes, it can effectively filter out false signals during range-bound periods and ensure entering the market with an established trend. This enables the strategy to deliver superior returns in trending markets.
Risks
The primary risk of the RSI strategy is generating false signals. When prices experience a short-term pullback within a trend rather than a full reversal, RSI may briefly poke into the overbought/oversold area and trigger wrong signals. Following such signals and trading in the opposite direction is likely to cause stops to be hit.
Another risk is RSI divergence. Price moves may have started a new trend, but RSI remains stuck in the previous overbought/oversold zone, leading to incorrect signal generation. Blindly following RSI signals in such cases could lead to failed trades.
Also, solely relying on RSI and ignoring price action and market context introduces biases. Mechanical RSI signals may fail in irrational market conditions.
Improvement Directions
The RSI strategy can be enhanced in the following aspects:
-
Add filters using other indicators like MACD, Bollinger Bands to avoid false signals.
-
Incorporate stop loss to limit losses on single trades.
-
Adjust parameters based on market trends and regimes, such as raising overbought threshold in bull market.
-
Optimize trading time to avoid major news events, only trade when trend is obvious.
-
Consider sizing up when trend accelerates to ride the trend.
-
Add waiting period to prevent premature RSI signal reversals.
-
Introduce money management rules like fixed trade size, position sizing etc.
Conclusion
The RSI strategy is a typical mean-reversion strategy that tracks overbought/oversold conditions. It is simple to use, customizable and can deliver decent profits when clear overextensions exist in trending markets. But inherent systematic risks call for enhancements like filtering, stop loss, parameter tuning, money management etc. When properly executed, the RSI strategy can be an effective tool for short-term traders to harvest relatively steady gains.
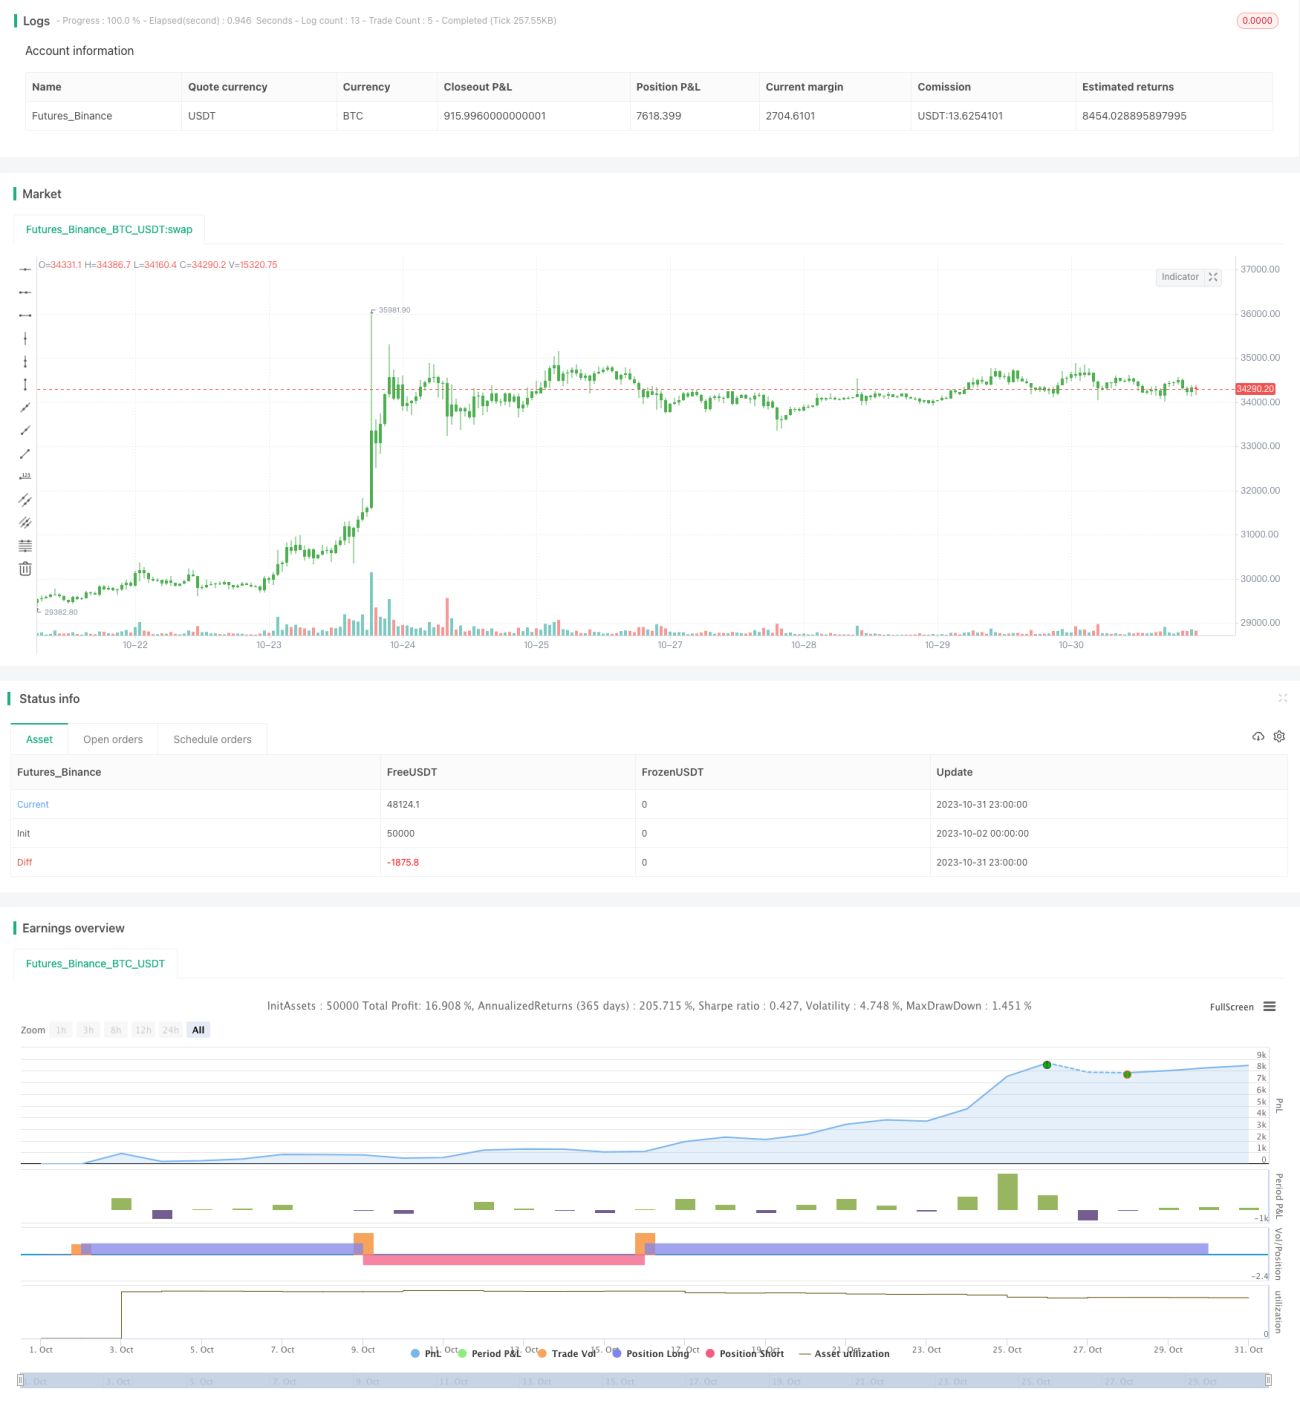
/*backtest
start: 2023-10-02 00:00:00
end: 2023-11-01 00:00:00
period: 1h
basePeriod: 15m
exchanges: [{"eid":"Futures_Binance","currency":"BTC_USDT"}]
*/

//@version=2
////////////////////////////////////////////////////////////
//  Copyright by HPotter v1.0 10/01/2017
// The RSI is a very popular indicator that follows price activity. - 1