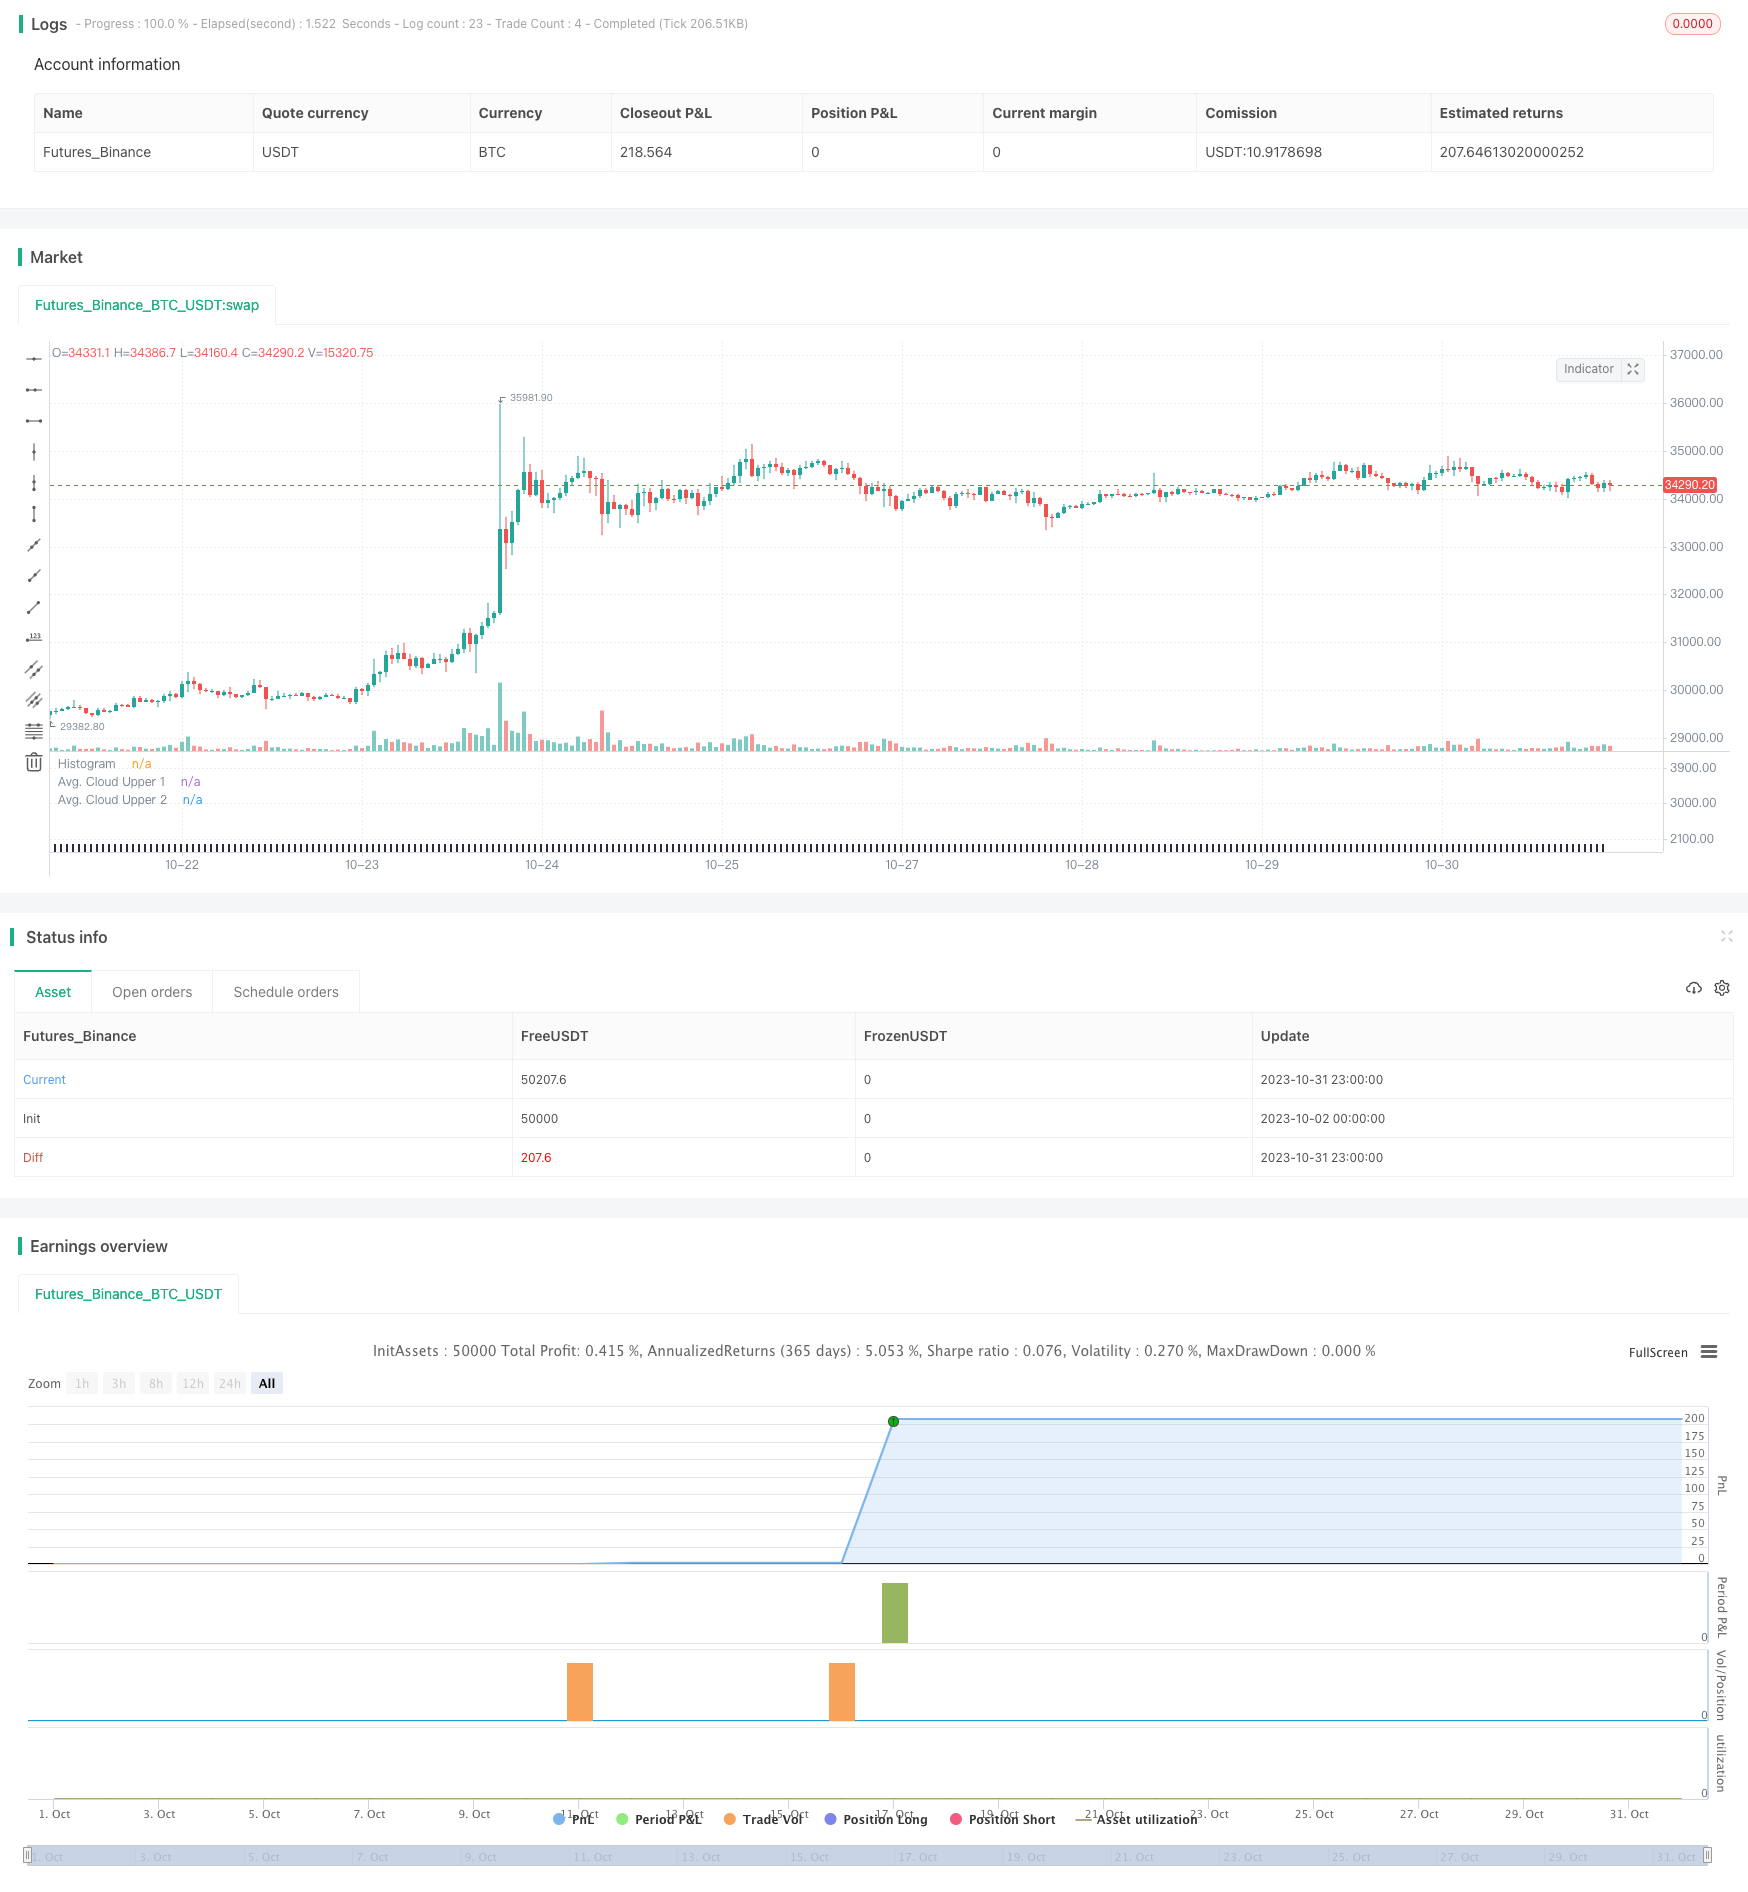
概述
本策略的核心思想是结合双均线和MACD指标来判断趋势方向,实现趋势跟踪交易。当短期均线上穿长期均线时,判断为看涨机会;当短期均线下穿长期均线时,判断为看跌机会。MACD指标用来判断买卖点,当MACD柱上穿0轴时看涨,下穿时看跌。
策略原理
计算快线EMA(12日线)、慢线EMA(26日线)和信号线EMA(9日线)。
计算MACD柱线(快线-慢线)和MACD信号线(MACD的9日线)。
计算50日线和200日线作为判断大趋势的均线。
MACD柱线上穿0轴作为看涨信号,下穿0轴作为看跌信号。
快线上穿慢线并且短期均线上穿长期均线作为看涨信号。
快线下穿慢线并且短期均线下穿长期均线作为看跌信号。
每次均线方向改变后,允许进场几次交易,通过Max trades after EMA cross参数控制。
进场后通过止损止盈平仓。
策略优势
双均线判断大趋势,避免逆势交易。
MACD判断买卖点,能及时捕捉趋势转换。
结合双均线和MACD指标,能在趋势中捕捉较好的入场时机。
设置最大交易次数,避免追涨杀跌。
止损止盈机制控制风险。
可通过参数优化获得更好的Parameter Combination。
策略风险
大趋势判断错误,导致逆势交易亏损。可适当放宽均线差距要求,确保捕捉到大趋势。
MACD买卖信号存在滞后,可能导致入场过早或过晚。可调整MACD参数,也可以结合其他指标过滤信号。
止损止盈设置不当,可能过于宽松或过于收紧,导致止损过多或止盈不足。需针对不同品种进行参数优化测试。
参数优化困难,不同品种和时间周期需要不同参数组合,需大量前置测试工作。
策略优化方向
尝试其它均线指标判断大趋势,如KD指标。
尝试结合其它指标辅助MACD过滤信号,如布林带、ATR止损。
优化止损止盈参数,针对不同品种分别测试找到最佳参数组合。
利用步进优化和随机优化方法寻找更优参数组合。
增加降低交易频次的机制,如MACD零轴附近设置成交禁区。
针对多品种自动进行参数优化和组合优化。
总结
本策略综合运用双均线判断大趋势和MACD判断买卖点的优点,形成一个较强的趋势跟踪策略。通过参数优化和指标组合还可进一步提升策略表现。总体来说,该策略具有较强的抗风险能力和盈利空间,值得考量在实盘中应用。但仍需针对不同品种分别进行参数优化测试,以确保策略稳定性。
/*backtest
start: 2023-10-02 00:00:00
end: 2023-11-01 00:00:00
period: 1h
basePeriod: 15m
exchanges: [{"eid":"Futures_Binance","currency":"BTC_USDT"}]
*/

//@version=5
strategy(title="ComiCo - Joel on Crypto - MACD Scalping", shorttitle="ComiCo - Joel on Crypto - MACD Scalping")
// Getting inputs
slow_length1 = input(title="EMA Trend 1", defval=50)
slow_length2 = input(title="EMA Trend 2 ", defval=200)
fast_length = input(title="MACD Fast Length", defval=12)
slow_length = input(title="MACD Slow Length", defval=26)
signal_length = input.int(title="MACD Signal Smoothing",  minval = 1, maxval = 50, defval = 9)
src = input(title="MACD Source", defval=close)

i_switch = input.string(title="Tick Highlight", defval="Moving average" ,options=["Moving average","Fixed value" ])
i_switch2 = input.string(title="Tick Source", defval="Highest bar" ,options=["Highest bar","Average","Last bar"])

signal_lengthup = input.int(title="Upticks Avg. Length",  minval = 1, maxval = 5000, defval = 72)
signal_lengthdown = input.int(title="Downticks Avg. Length",  minval = 1, maxval = 5000, defval = 72)

signal_lengthMA = input.float(title="Ticks Avg. Multiplier",  minval = 0, maxval = 5000, defval = 2, step = 0.1)

sma_source = "EMA"
sma_signal = "EMA"
// Plot colors

col_grow_above = #26A69A
col_fall_above =#B2DFDB
col_grow_below = #FFCDD2
col_fall_below = #FF5252
// Calculating

fast_ma = sma_source == "SMA" ? ta.sma(src, fast_length) : ta.ema(src, fast_length)
slow_ma = sma_source == "SMA" ? ta.sma(src, slow_length) : ta.ema(src, slow_length)

time_macd=timeframe.period=="1"?"1": timeframe.period=="3"?"1": timeframe.period=="5"?"1": timeframe.period=="15"?"3":timeframe.period=="30"?"5":timeframe.period=="60"?"15":timeframe.period=="120"?"30":timeframe.period=="240"?"60":timeframe.period=="D"?"240":timeframe.period=="W"?"D":timeframe.period=="M"?"W":timeframe.period=="12M"?"M":timeframe.period


macd = fast_ma - slow_ma
macd1=request.security(syminfo.tickerid, time_macd, macd)
signal = sma_signal == "SMA" ? ta.sma(macd1, signal_length) : ta.ema(macd1, signal_length)

ema50=ta.ema(close,slow_length1)
ema200=ta.ema(close ,slow_length2)

var TradeCounter = 0
MaxCount = input.int(title = "Max trades after EMA cross", minval = 0, maxval = 1000, defval = 3)
bull = ema50>ema200
if bull != bull[1]
    TradeCounter := 0


hist = request.security(syminfo.tickerid, time_macd, macd1 - signal)


f() => [hist[4],hist[3],hist[2],hist[1], hist]
ss=request.security(syminfo.tickerid, time_macd, hist, barmerge.gaps_on,barmerge.lookahead_off)


[ss5,ss4,ss3,ss2,ss1]=request.security(syminfo.tickerid, time_macd, f(), barmerge.gaps_on,barmerge.lookahead_off)


a = array.from(ss5,ss4,ss3,ss2,ss1)

s3=i_switch2=="Highest bar"?(ss>0? array.max(a, 0) : array.min(a, 0)):i_switch2=="Average"?array.avg(a):i_switch2=="Last bar"?ss1:0

saa=timeframe.period == '1'? ss:s3

saa2=timeframe.period == '1'? ss:s3*signal_lengthMA


colorss=(s3>=0 ? (s3[1] < s3 ? col_grow_above : col_fall_above) : (s3[1] < s3 ? col_grow_below : col_fall_below))


saadown = saa2
saaup = saa2

saadown:=saa>=0? saa2:saadown[1]

saaup:=saa<0? saa2:saaup[1]


verr=ta.ema(saadown,signal_lengthup)
dowww=ta.ema(saaup,signal_lengthdown)

ss22=plot(verr, title="Avg. Cloud Upper 1", color=color.new(color.white, 100))
ss33=plot(dowww, title="Avg. Cloud Lower 1", color=color.new(color.white, 100))

fill(ss22, ss33, color.new(color.white, 93), title="Avg. Cloud Background")

fixeduptick = input(title="Fixed Uptick Value", defval=30)
fixeddowntick = input(title="Fixed Downtick Value", defval=-30)
minl = i_switch=="Fixed value"? fixeduptick  :  verr
maxl = i_switch=="Fixed value"? fixeddowntick : dowww

plot(minl, title="Avg. Cloud Upper 2", color=color.new(color.white, 81))
plot(maxl, title="Avg. Cloud Lower 2", color=color.new(color.white, 81))


colors2= s3<=minl and s3>=maxl ? #2a2e39 : colorss

coro2=s3>0? ema50>ema200 ? #2a2e39 :  colors2 : ema50<ema200 ? #2a2e39: colors2
plot(saa, title="Histogram", style=plot.style_columns, color=coro2)

LimitDiff = input.float(title="Limit Price Difference",  minval = 0, maxval = 0.1, defval = 0.005, step = 0.0005)
TP = input.float(title="Take Profit",  minval = 0, maxval = 0.1, defval = 0.005, step = 0.0005)
SL = input.float(title="Stop Loss",  minval = 0, maxval = 0.1, defval = 0.004, step = 0.0005)

minEMAdiff = input.float(title = "Min EMA difference", defval = 100, step = 10)

if #2a2e39 != coro2
    a22 = 0
    if ema50<ema200 and TradeCounter < MaxCount and math.abs(ema50-ema200) > minEMAdiff
        LimitPrice = close * (1 + LimitDiff)
        strategy.entry("enter short", strategy.short, limit = LimitPrice)
        strategy.exit("exit short", "enter short", limit = LimitPrice * (1 - TP), stop = LimitPrice * (1 + SL))
        TradeCounter := TradeCounter + 1
    if ema50>ema200 and TradeCounter < MaxCount and math.abs(ema50-ema200) > minEMAdiff
        LimitPrice = close * (1 - LimitDiff)
        strategy.entry("enter long", strategy.long, limit = LimitPrice)
        strategy.exit("exit long", "enter long", limit = LimitPrice * (1 + TP), stop = LimitPrice * (1 - SL))
        TradeCounter := TradeCounter + 1

//alertcondition(#2a2e39 != coro2 , title='MACD Tick Alert', message='Joel on Crypto - MACD Tick Alert')