Heiken Ashi and Super Trend Strategy

Author: ChaoZhang, Date: 2023-11-02 16:15:18
Tags:

img

Overview

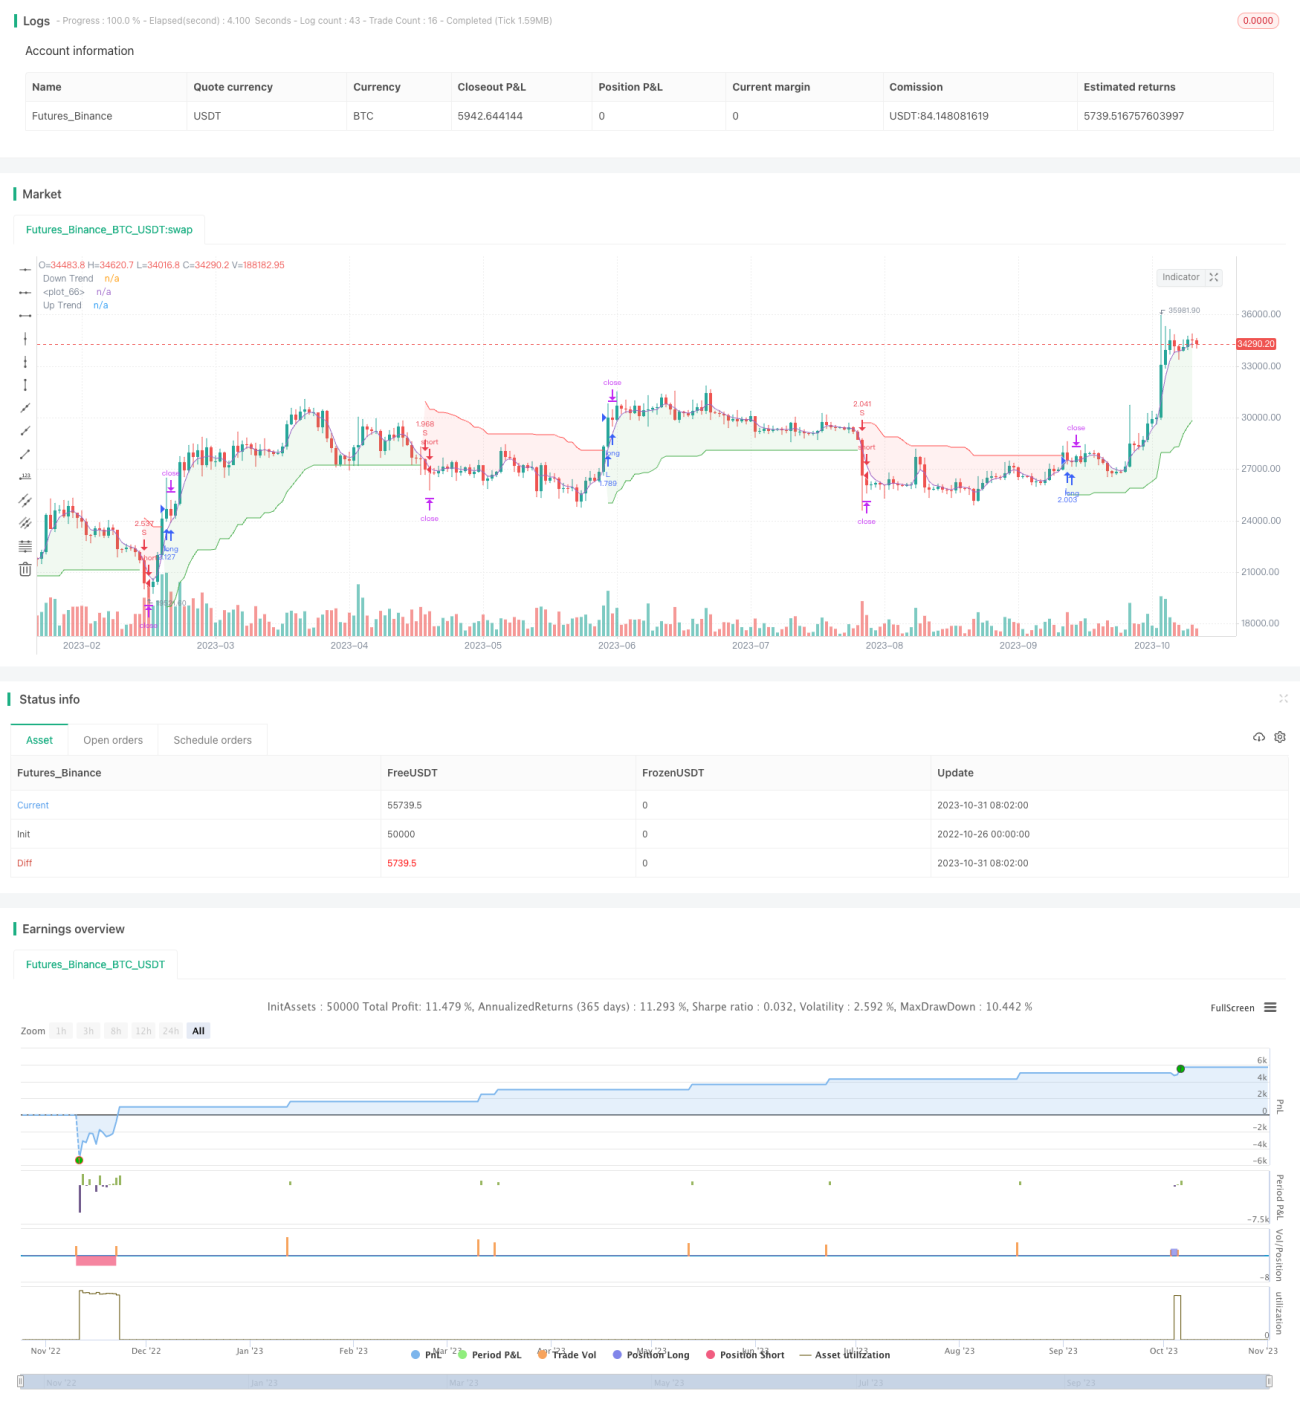
The Heiken Ashi and Super Trend strategy is a trend-following strategy that combines the Heiken Ashi candlesticks and the Super Trend indicator. It aims to identify trend direction, trade with the trend, and exit quickly when the trend reverses, to minimize losses from non-trend trades.

Strategy Logic

Heiken Ashi candles are a special type of candlesticks that use the average of open, close, high and low prices to plot candle bodies, filtering out market noise and making the pattern clearer. The Super Trend indicator consists of two lines forming dynamic support and resistance to determine the trend direction.

The strategy first calculates the Heiken Ashi candles, then computes the Super Trend indicator based on the Heiken Ashi candles. Trading signals are generated when the price breaks through the Super Trend lines. Specifically, the strategy uses Heiken Ashi candles to calculate the true range, then derives the upper and lower bands of Super Trend using the range and average price. Long signals are generated when the price breaks above the lower band, and short signals when the price breaks below the upper band.

The Super Trend parameters are also optimized for best results, improving the sensitivity of the indicator. Also, a stop loss mechanism is implemented to control risks while locking profits.

Advantage Analysis

  • Heiken Ashi candles filter out noise for clearer signals.
  • Super Trend rapidly catches trend changes and generates timely signals.
  • Parameter optimization improves reliability of the indicator.
  • Built-in stop loss mechanism effectively controls risks.
  • High degree of automation by combining trend following and automated trading.

Risk Analysis

  • High automation requires close monitoring to avoid abnormalities.
  • Heiken Ashi may miss very small reversal signals when filtering noise.
  • Super Trend may generate false signals, causing premature entry or stop loss.
  • Improper stop loss placement can also lead to unnecessary losses.
  • Insufficient backtesting data may cause overfitting. Live results may deviate significantly from backtest.

Optimization Directions

  • Test more parameter combinations to further optimize Super Trend.
  • Add other indicators to confirm Super Trend signals and reduce false signals.
  • Optimize stop loss strategy to minimize unnecessary stops while locking profits.
  • Incorporate machine learning algorithms to train judgment of real trends using big data.
  • Use longer timeframes and more diverse historical data for backtesting to improve reliability.

Summary

The Heiken Ashi and Super Trend strategy is a trend following strategy. It identifies trend direction and trades with the major trend, while quickly stopping out on reversals. The strategy integrates Heiken Ashi’s noise filtering and Super Trend’s rapid trend change detection. Parameter optimization and stop loss design allow maximizing returns while controlling risks. Future optimizations may include further parameter tuning, additional signal confirmation, expanded backtesting data, etc. to enhance the strategy’s stability and reliability.


/*backtest
start: 2022-10-26 00:00:00
end: 2023-11-01 00:00:00
period: 1d
basePeriod: 1h
exchanges: [{"eid":"Futures_Binance","currency":"BTC_USDT"}]
*/

//@version=5

strategy("Heiken Ashi & Super Trend_ARM", overlay=true,  pyramiding=1,initial_capital = 10000, default_qty_type= strategy.percent_of_equity, default_qty_value = 100, calc_on_order_fills=false, slippage=0,commission_type=strategy.commission.percent,commission_value=0.02)

///////////////////////////////////////////////////
////////////////////Function///////////////////////
///////////////////////////////////////////////////


heikinashi_open = request.security(ticker.heikinashi(syminfo.tickerid), timeframe.period, open)
heikinashi_high = request.security(ticker.heikinashi(syminfo.tickerid), timeframe.period, high)
heikinashi_low  = request.security(ticker.heikinashi(syminfo.tickerid), timeframe.period, low)
heikinashi_close= request.security(ticker.heikinashi(syminfo.tickerid), timeframe.period, close)
heikinashi_color = heikinashi_open < heikinashi_close ? #53b987 : #eb4d5c
// plotbar(heikinashi_open, heikinashi_high, heikinashi_low, heikinashi_close, color=heikinashi_color)

x_sma(x, y) =>
    sumx = 0.0
    for i = 0 to y - 1
        sumx := sumx + x[i] / y
    sumx

x_rma(src, length) =>
	alpha = 1/length
	sum = 0.0
	sum := na(sum[1]) ? x_sma(src, length) : alpha * src + (1 - alpha) * nz(sum[1])

x_atr(length) =>
    trueRange = na(heikinashi_high[1])? heikinashi_high-heikinashi_low : math.max(math.max(heikinashi_high - heikinashi_low, math.abs(heikinashi_high - heikinashi_close[1])), math.abs(heikinashi_low - heikinashi_close[1]))
    //true range can be also calculated with ta.tr(true)
    x_rma(trueRange, length)

x_supertrend(factor, atrPeriod) =>
	src = (heikinashi_high+heikinashi_low)/2
	atr = x_atr(atrPeriod)
	upperBand = src + factor * atr
	lowerBand = src - factor * atr
	prevLowerBand = nz(lowerBand[1])
	prevUpperBand = nz(upperBand[1])

	lowerBand := lowerBand > prevLowerBand or heikinashi_close[1] < prevLowerBand ? lowerBand : prevLowerBand
	upperBand := upperBand < prevUpperBand or heikinashi_close[1] > prevUpperBand ? upperBand : prevUpperBand
	int direction = na
	float superTrend = na
	prevSuperTrend = superTrend[1]
	if na(atr[1])
		direction := 1
	else if prevSuperTrend == prevUpperBand
		direction := heikinashi_close > upperBand ? -1 : 1
	else
		direction := heikinashi_close < lowerBand ? 1 : -1
	superTrend := direction == -1 ? lowerBand : upperBand
	[superTrend, direction]
	

///////////////////////////////////////////////////
////////////////////Indicators/////////////////////
///////////////////////////////////////////////////

factor = input.float(3.0, "Factor", step = 0.01)
atrPeriod = input(10, "ATR Length")


[supertrend, direction] = x_supertrend(factor, atrPeriod)

bodyMiddle = plot((heikinashi_open + heikinashi_close) / 2, display=display.none)
upTrend = plot(direction < 0 ? supertrend : na, "Up Trend", color = color.green, style=plot.style_linebr)
downTrend = plot(direction < 0? na : supertrend, "Down Trend", color = color.red, style=plot.style_linebr)

fill(bodyMiddle, upTrend, color.new(color.green, 90), fillgaps=false)
fill(bodyMiddle, downTrend, color.new(color.red, 90), fillgaps=false)

///////////////////////////////////////////////////
////////////////////Strategy///////////////////////
///////////////////////////////////////////////////

var bool longCond                    = na, var bool shortCond                   = na, longCond := nz(longCond[1]), shortCond := nz(shortCond[1])
var int CondIni_long                 = 0, var int CondIni_short                 = 0, CondIni_long := nz(CondIni_long[1]), CondIni_short := nz(CondIni_short[1])
var float open_longCondition         = na, var float open_shortCondition   = na


long  = ta.change(direction) < 0
short = ta.change(direction) > 0


longCond        :=                                                              long
shortCond       :=                                                              short

CondIni_long    :=                                                              longCond[1] ? 1 : shortCond[1] ? -1 : nz(CondIni_long[1])
CondIni_short   :=                                                              longCond[1] ? 1 : shortCond[1] ? -1 : nz(CondIni_short[1])
longCondition   =                                                               (longCond[1] and nz(CondIni_long[1]) == -1)
shortCondition  =                                                               (shortCond[1] and nz(CondIni_short[1]) == 1)


open_longCondition             :=                                          long ? close[1] :                                                      nz(open_longCondition[1])
open_shortCondition            :=                                          short ? close[1] :                                                     nz(open_shortCondition[1])


//TP
tp                    = input.float(1.1  , "TP [%]",                      step = 0.1) 

//BACKTESTING inputs --------------------------------------------------------------------------------------------------------------------------------------------------------------------------------------------------------------------------------------------------------------------------------------------------------

testStartYear       =                   input.int(2000,                             title="start year",                                         minval = 1997, maxval = 3000,                                                   group= "BACKTEST") 
testStartMonth      =                   input.int(01,                               title="start month",                                        minval = 1, maxval = 12,                                                        group= "BACKTEST")
testStartDay        =                   input.int(01,                               title="start day",                                          minval = 1, maxval = 31,                                                        group= "BACKTEST")
testPeriodStart     =                   timestamp(testStartYear,testStartMonth,testStartDay,0,0)
testStopYear        =                   input.int(3333,                             title="stop year",                                          minval=1980, maxval = 3333,                                                     group= "BACKTEST")
testStopMonth       =                   input.int(12,                               title="stop month",                                         minval=1, maxval=12,                                                            group= "BACKTEST")
testStopDay         =                   input.int(31,                               title="stop day",                                           minval=1, maxval=31,                                                            group= "BACKTEST")
testPeriodStop      =                   timestamp(testStopYear, testStopMonth, testStopDay, 0, 0)
testPeriod          =                   time >= testPeriodStart and time <= testPeriodStop ? true : false

// Backtest  ==================================================================================================================================================================================================================================================================================================================================


if longCond
    strategy.entry("L", strategy.long, when=testPeriod)

if shortCond
    strategy.entry("S", strategy.short, when=testPeriod)
    

strategy.exit("TP_L", "L", profit =((open_longCondition   *       (1+(tp/100))) - open_longCondition)/syminfo.mintick)

strategy.exit("TP_S", "S", profit =((open_shortCondition  *       (1+(tp/100))) - open_shortCondition)/syminfo.mintick)


More