Intraday Pivot Breakout Strategy

Author: ChaoZhang, Date: 2023-11-03 16:35:15
Tags:

img

Overview

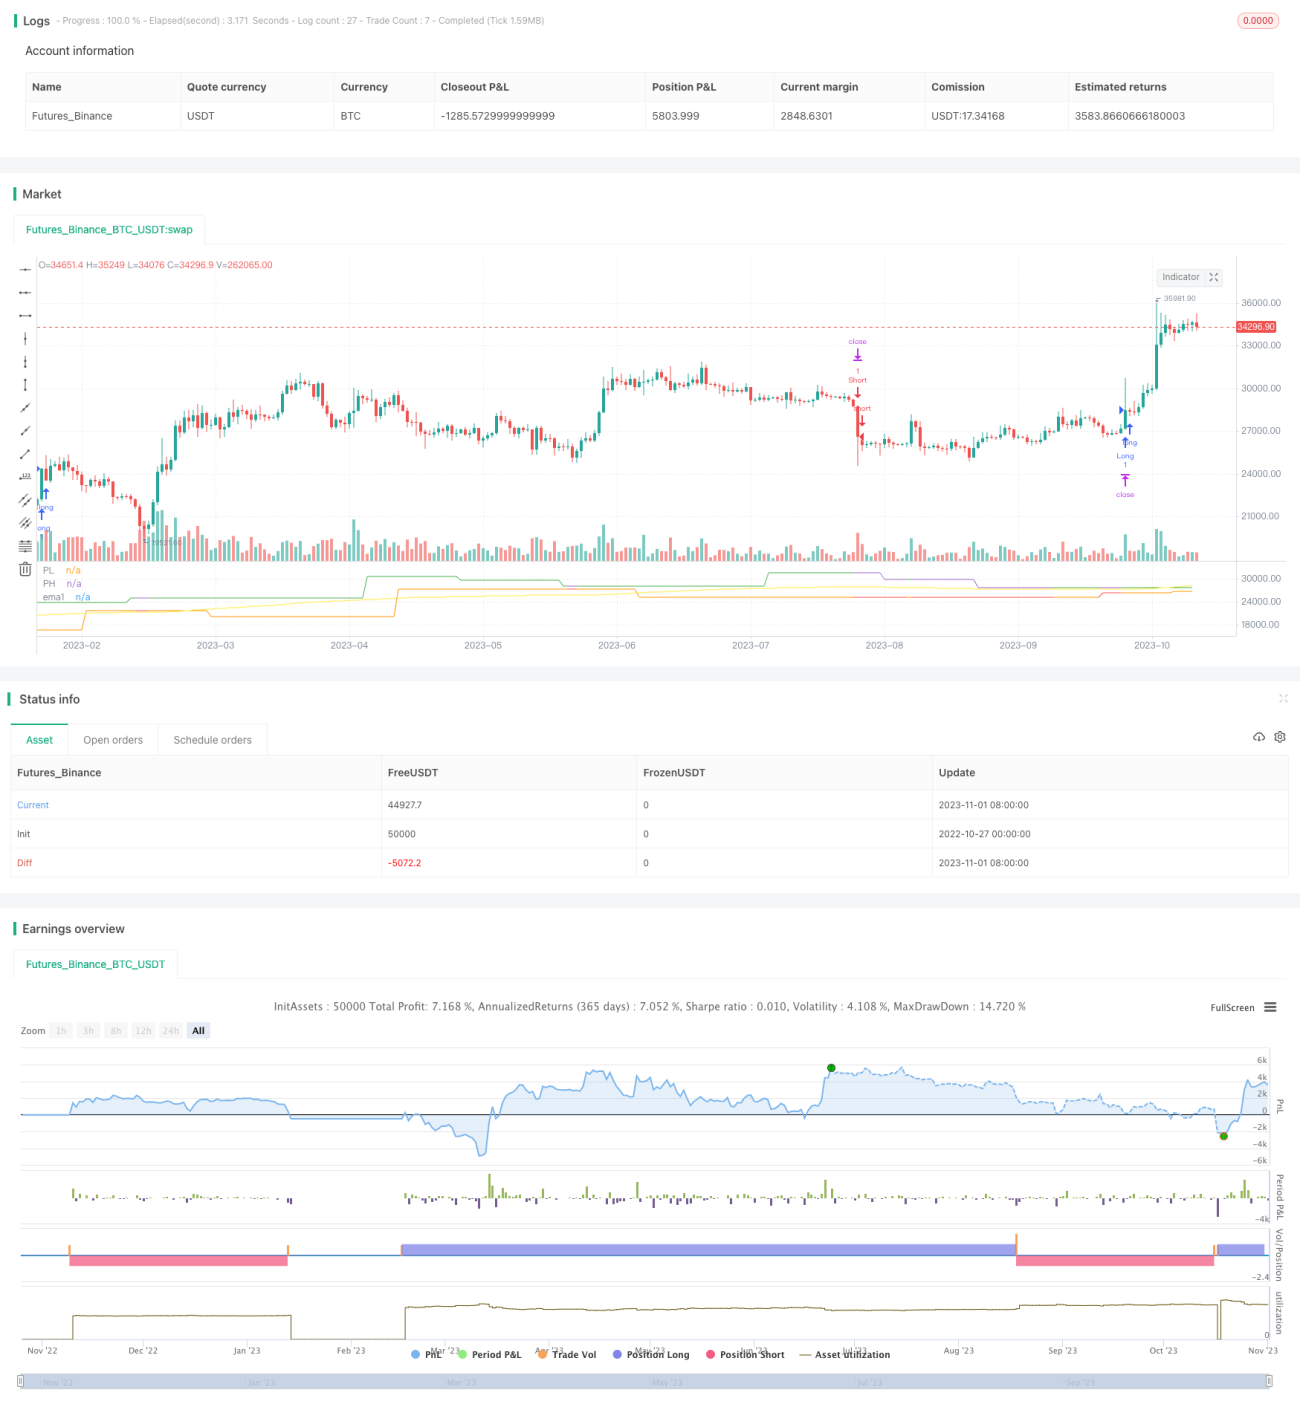
This strategy generates trading signals based on price breakouts within a specified time period. The main idea is to observe price movements during certain periods and use breakouts in price range to determine trend changes.

Strategy Logic

The strategy calculates the highest high and lowest low of price within a certain timeframe, known as pivot high and pivot low, to gauge price movements.

Specifically, it computes the highest high of past N bars as the pivot high and the lowest low of past M bars as the pivot low. A long signal is generated when the current bar’s high breaks above the pivot high. A short signal is generated when the current bar’s low breaks below the pivot low.

After entry, the strategy uses ATR for stop loss and intraday stop loss. It also closes all positions at a specific timeframe (e.g. 14:55).

The strategy effectively captures trends using simple price breakouts during certain periods, making it ideal for intraday trading. The logic is clear and easy to implement.

Advantages

  • Captures trend changes reliably using price breakouts
  • Simple implementation with basic OHLC data
  • Reasonable stop loss and intraday stop loss manage risks
  • Avoids overnight risks suitable for intraday trading
  • Few parameters easy to optimize

Risks and Mitigations

  • Potential lag, may miss early trend start

    Adjust timeframe or combine other indicators for entry

  • More false signals when trend is unclear

    Tune parameters, add filters like indicators, volume etc.

  • Higher capital costs for active intraday trading

    Adjust position sizing, extend holding period

  • Reliance on parameter optimization

    Adapt parameters to changing market conditions using machine learning etc.

Enhancement Opportunities

  • Test other price data like typical price, median price etc.

  • Add filters like volume, volatility

  • Try different parameter combinations

  • Incorporate trend indicators to determine direction

  • Auto-optimize parameters using machine learning

  • Expand to multiple timeframes for better entry

Conclusion

The strategy has a clear and concise logic, effectively capitalizing on price breakouts to capture short-term trends with good profit factors. With few tunable parameters easy for testing and optimization, it is well suited for intraday trading. While lag and false signals exist, they can be addressed through parameter tuning, adding filters etc. The strategy provides a robust breakout-based trading framework with ample optimization space.


/*backtest
start: 2022-10-27 00:00:00
end: 2023-11-02 00:00:00
period: 1d
basePeriod: 1h
exchanges: [{"eid":"Futures_Binance","currency":"BTC_USDT"}]
*/

//   ____________        _________           _____________
//  |____________|      ||________|          ||__________|
//       ||             ||        ||         ||
//       ||             ||________||         ||
//       ||     H E     ||________   U L L   ||       H A R T I S T
//       ||             ||        ||         ||
//       ||             ||________||         ||__________
//       ||             ||________|          ||__________|
  
//@version=5
// strategy("PIVOT STRATEGY [5MIN TF]",overlay=true ,commission_type = strategy.cash, commission_value = 30 , slippage = 2, default_qty_value = 60, currency = currency.NONE, pyramiding = 0)
leftbars = input(defval = 10)
rightbars = input(defval = 15)

// ═══════════════════════════ //
// ——————————> INPUTS <——————— //
// ═══════════════════════════ //

EMA1 = input.int(title='PRICE CROSS EMA', defval = 150, minval = 10 ,maxval = 400)
factor1 = input.float(title='_ATR LONG',defval = 3.2 , minval = 1 , maxval = 5 , step = 0.1, tooltip = "ATR TRAIL LONG")
factor2 = input.float(title='_ATR SHORT',defval = 3.2 , minval = 1 , maxval = 5 , step = 0.1, tooltip = "ATR TRAIL SHORT")
risk = input.float(title='RISK',defval = 200 , minval = 1 , maxval = 5000 , step = 50, tooltip = "RISK PER TRADE")

var initialCapital = strategy.equity
t = time(timeframe.period, '0935-1400:1234567')
time_cond = true

// ══════════════════════════════════ //
// ———————————> EMA DATA <——————————— //
// ══════════════════════════════════ //
ema1 = ta.ema(close, EMA1)

plot(ema1, color=color.new(color.yellow, 0), style=plot.style_linebr, title='ema1')

// ══════════════════════════════════ //
// ————————> TRAIL DATA <———————————— //
// ══════════════════════════════════ //
// *******Calculate LONG TRAIL data*****
ATR_LO = ta.atr(14)*factor1

// *******Calculate SHORT TRAIL data*****
ATR_SH = ta.atr(14)*factor2

longStop = close - ATR_LO
shortStop = close + ATR_SH

// Plot atr data
//plot(longStop, color=color.new(color.green, 0), style=plot.style_linebr, title='Long Trailing Stop')
//plot(shortStop , color=color.new(color.red, 0), style=plot.style_linebr, title='Short Trailing Stop')

// ══════════════════════════════════════════════════════════════════════════════════════════════════════════════════════════════════════════════════════════════════════════ //
// ————————————————————————————————————————————————————————> PIVOT DATA <———————————————————————————————————————————————————————————————————————————————————————————————————— //
// ══════════════════════════════════════════════════════════════════════════════════════════════════════════════════════════════════════════════════════════════════════════ //

ph = ta.pivothigh(close,leftbars, rightbars)
pl = ta.pivotlow(close,leftbars, rightbars)

pvt_condition1 = not na(ph)

upper_price = 0.0
upper_price := pvt_condition1 ? ph : upper_price[1]

pvt_condition2 = not na(pl)

lower_price = 0.0
lower_price := pvt_condition2 ? pl : lower_price[1]

// Signals
long  = ta.crossover(high, upper_price + syminfo.mintick)
short = ta.crossunder(low, lower_price - syminfo.mintick)

plot(upper_price, color= close > ema1  ? color.green : na, style=plot.style_line, title='PH')

plot(lower_price,  color= close <  ema1  ? color.red : na, style=plot.style_line, title='PL')


// ══════════════════════════════════//
// ————————> LONG POSITIONS <————————//
// ══════════════════════════════════//
//******barinstate.isconfirmed used to avoid repaint in real time*******

if ( long and strategy.opentrades==0 and barstate.isconfirmed and time_cond and close >= ema1 )
    strategy.entry(id= "Long" ,direction = strategy.long, comment = "B")
    
//plot(longStop , color=color.new(color.blue, 0), style=plot.style_linebr, title='long Stop')

if strategy.position_size > 0 
    strategy.exit("long tsl", "Long" , stop = longStop ,comment='S')
 

// ═════════════════════════════════════//
// ————————> SHORT POSITIONS <————————— //
// ═════════════════════════════════════//
if ( short and strategy.opentrades==0 and barstate.isconfirmed and time_cond and close <= ema1 )
    strategy.entry(id = "Short" ,direction = strategy.short,  comment = "S") 

if strategy.position_size < 0
    strategy.exit("short tsl", "Short" ,  stop = shortStop ,comment='B')

// ════════════════════════════════════════════════//
// ————————> CLOSE ALL POSITIONS BY 3PM <————————— //
// ════════════════════════════════════════════════//
strategy.close_all(when = hour == 14 and minute == 55)

// ════════════════════════════════════════//
// ————————> MAX INTRADAY LOSS  <————————— //
// ════════════════════════════════════════//
// strategy.risk.max_intraday_loss(type = strategy.cash, value = risk)


More