ADX Filtered Chande Kroll Stop Loss Trend Following Strategy

Author: ChaoZhang, Date: 2023-11-06 14:52:27
Tags:

img

Overview

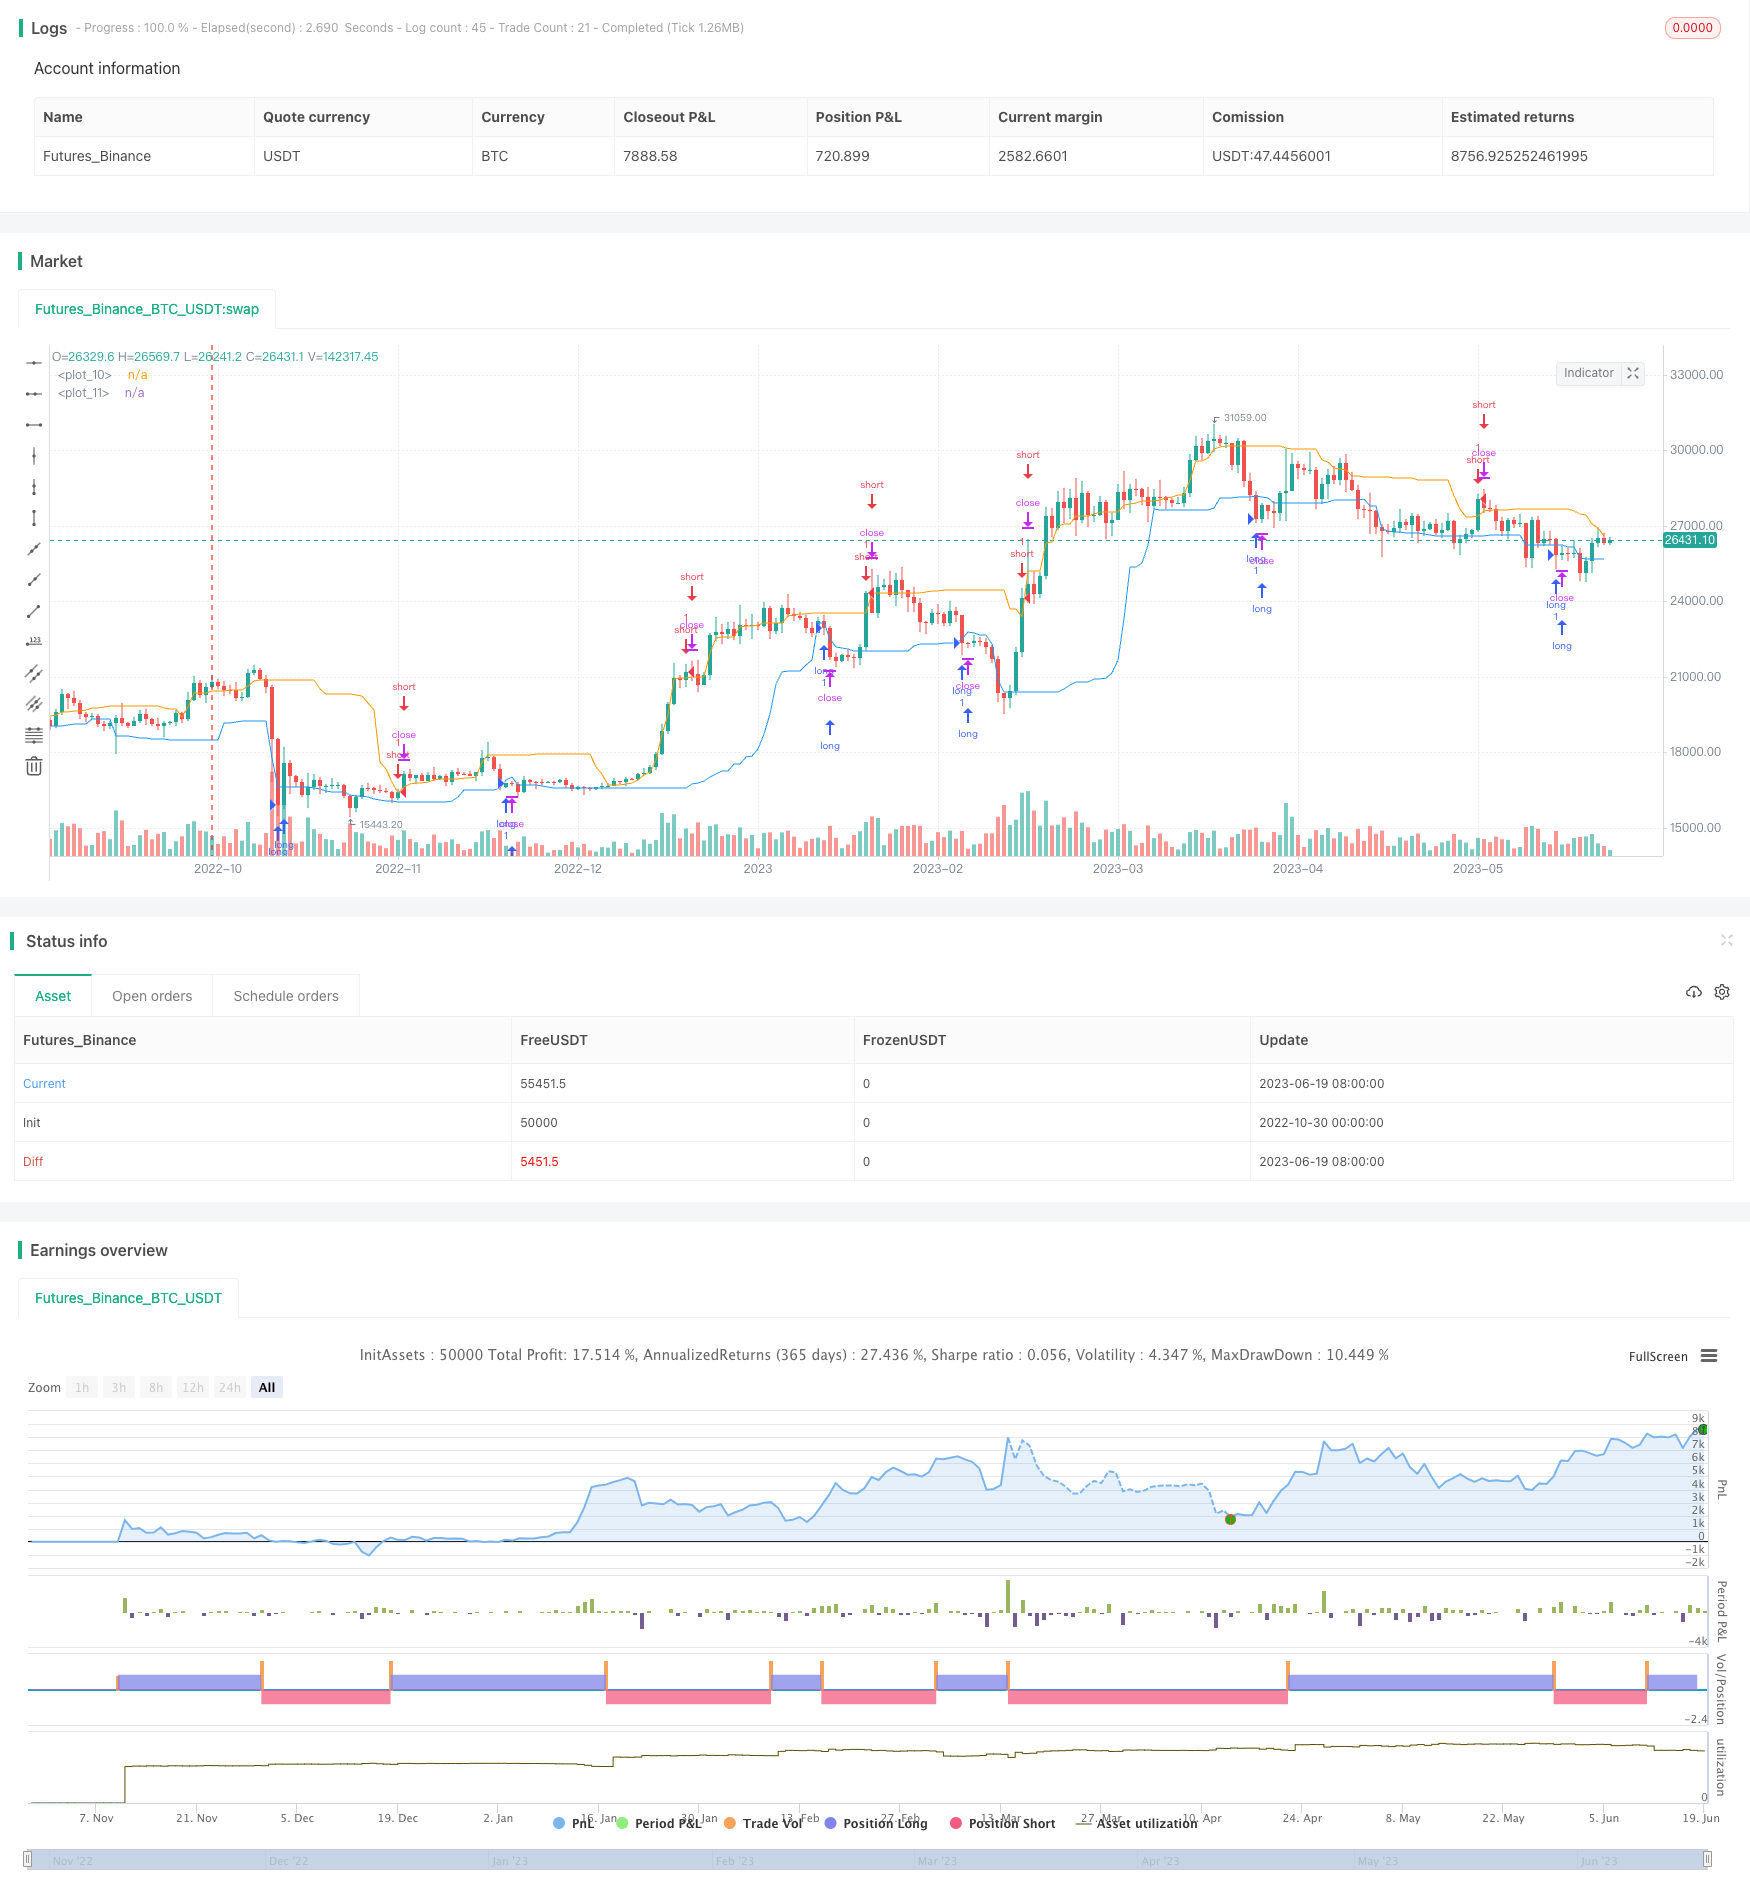
This strategy combines the Chande Kroll stop loss indicator and the Average Directional Movement Index (ADX) indicator to implement a relatively simple trend following strategy. Chande Kroll stop loss is used to generate long and short entry signals, while ADX filters out market conditions without a clear trend to avoid whipsaws from non-directional volatility triggering stop losses repeatedly.

Strategy Logic

The strategy first calculates the long stop long and short stop short lines of the Chande Kroll stop loss. The long line is calculated based on the highest price over the past p periods. The short line is calculated based on the lowest price over the past p periods. The highest point of the long and short lines over the past q periods are then used as the current long and short stop loss lines. This filters out short-term price fluctuations and only triggers stop loss at trend reversal points.

When the closing price crosses above the short line stop_short, a long signal is generated. When the closing price crosses below the long line stop_long, a short signal is generated.

In addition, the ADX indicator is used to judge the strength of the trend. Only when the ADX is greater than the threshold will the stop loss signal trigger entry. This filters out non-directional whipsaw in consolidation.

Advantages

The strategy combines the advantages of trend indicators and stop loss indicators. It can timely capture trend reversals while avoiding whipsaws in non-directional markets. Optimization of the Chande Kroll stop loss parameters can smooth filtering and ensure stop loss only at trend reversal points. The ADX indicator ensures entry only when the trend is significant, avoiding stop loss whipsaws during market consolidation.

Risks

Improper ADX parameter settings may miss opportunities at the beginning of trends. If the ADX threshold is set too high, entry opportunities may be missed at the beginning of trends when ADX values are still low.

Stop loss points that are too close may also cause frequent opening and closing of strategy positions. This will increase trading and slippage costs. Stop loss points need to be reasonably set to allow some space for trends.

Optimization

Consider allowing stop loss signals to trigger only when ADX breaks above a threshold. This can improve the reliability of entry timing. Other trend indicators can also be combined for conjunctive conditions, such as combining ADX values with EMA slopes.

Stop loss lines can also be dynamically adjusted based on ATR, allowing wider stops when market volatility increases to avoid excessive sensitivity. Or MACD can be used to evaluate trend strength and dynamically adjust stop loss lines.

Summary

The strategy integrates the strengths of Chande Kroll stop loss and ADX indicators to build a relatively simple and practical trend following strategy. Through parameter optimization, the stability and profitability of the strategy can be further improved. But risks of excessive stop loss sensitivity and insufficient ADX filtering need to be watched out for.


/*backtest
start: 2022-10-30 00:00:00
end: 2023-06-20 00:00:00
period: 1d
basePeriod: 1h
exchanges: [{"eid":"Futures_Binance","currency":"BTC_USDT"}]
*/

//@version=5
strategy(title = "Chande Kroll Stop", overlay=true)
p = input.int(10, minval=1)
x = input.int(1, minval=1)
q = input.int(9, minval=1)
first_high_stop = ta.highest(high, p) - x * ta.atr(p)
first_low_stop = ta.lowest(low, p) + x * ta.atr(p)
stop_short = ta.highest(first_high_stop, q)
stop_long = ta.lowest(first_low_stop, q)
plot(stop_long, color=color.blue)
plot(stop_short, color=color.orange)

adxlen = input(14, title="ADX Smoothing")
dilen = input(14, title="DI Length")
ADX_sig = input.int(20, title="minimum ADX threshold for signal")
dirmov(len) =>
	up = ta.change(high)
	down = -ta.change(low)
	plusDM = na(up) ? na : (up > down and up > 0 ? up : 0)
	minusDM = na(down) ? na : (down > up and down > 0 ? down : 0)
	truerange = ta.rma(ta.tr, len)
	plus = fixnan(100 * ta.rma(plusDM, len) / truerange)
	minus = fixnan(100 * ta.rma(minusDM, len) / truerange)
	[plus, minus]
adx(dilen, adxlen) =>
	[plus, minus] = dirmov(dilen)
	sum = plus + minus
	adx = 100 * ta.rma(math.abs(plus - minus) / (sum == 0 ? 1 : sum), adxlen)
sig = adx(dilen, adxlen)


if ta.crossunder(close, stop_long) and sig>ADX_sig
    strategy.entry("long", strategy.long)
if ta.crossover(close, stop_short) and sig>ADX_sig
    strategy.entry("short", strategy.short)

More