Dual Moving Average Channel with Trend Tracking Strategy

Author: ChaoZhang, Date: 2023-11-06 15:41:23
Tags:

img

Overview

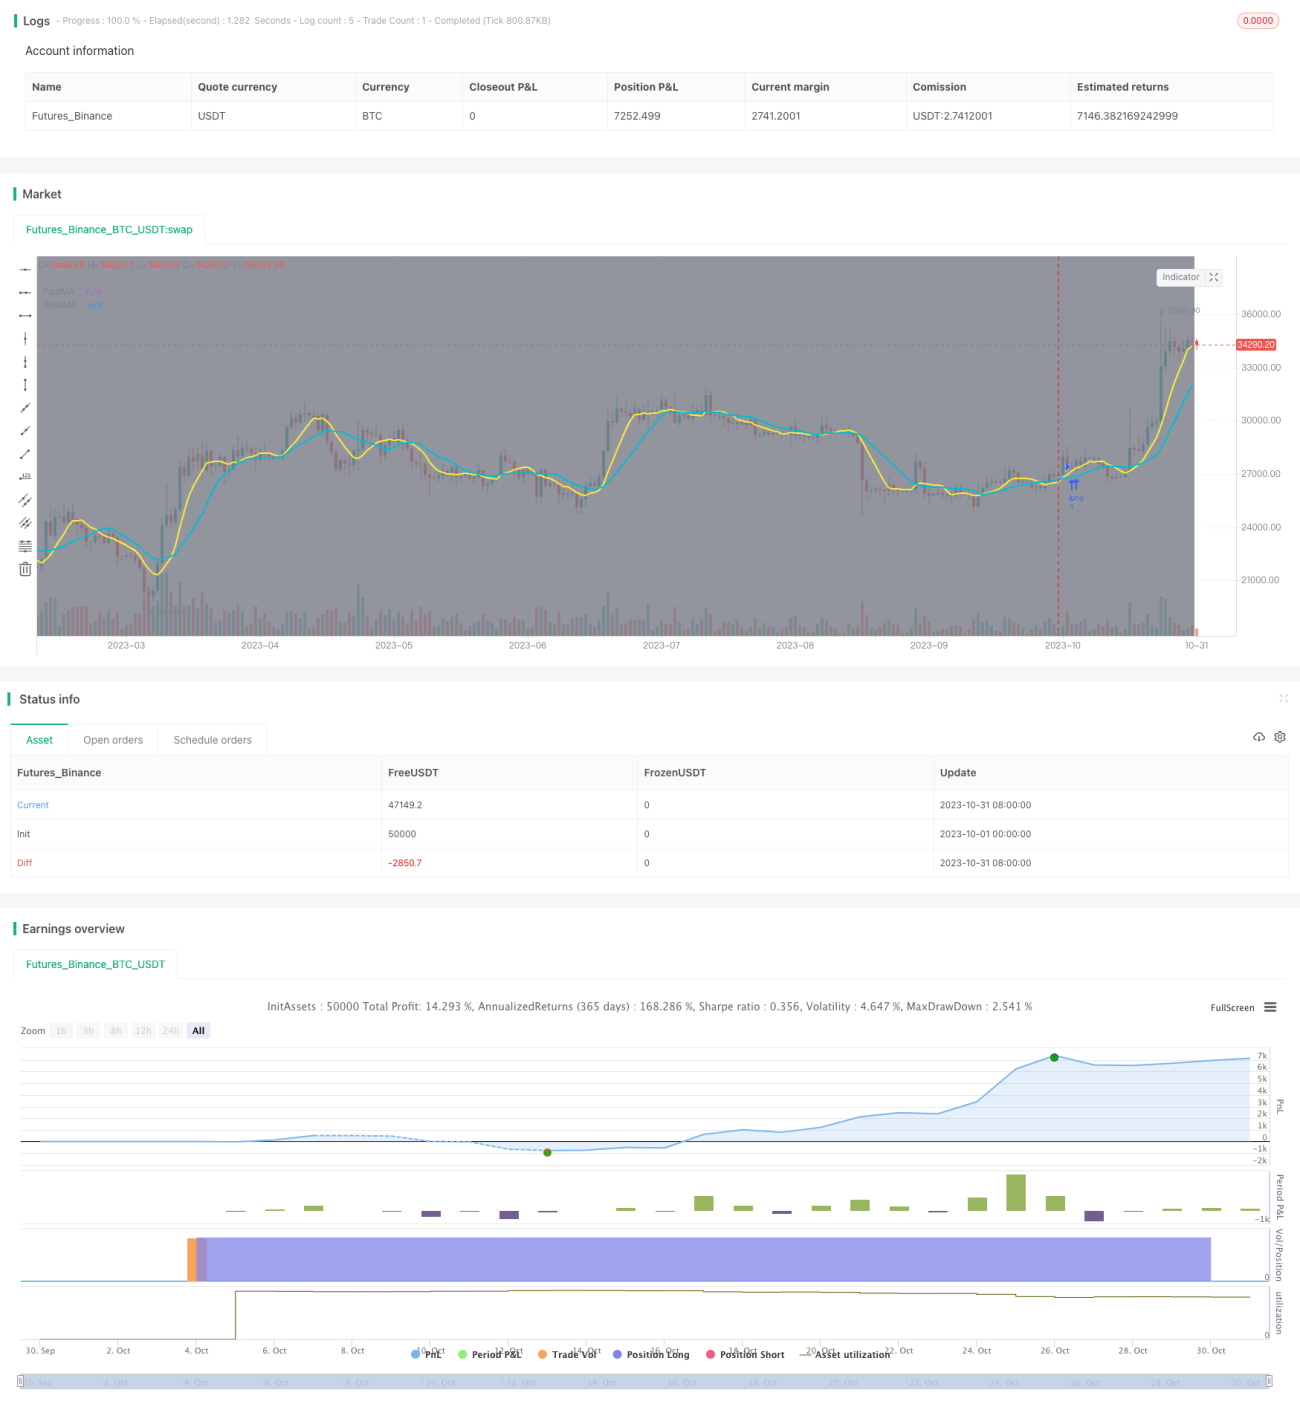
This strategy uses fast and slow moving averages to build a dual-rail system, combined with the trend index ADX for trend judgment and the DMI directional index to determine the trend direction, to track the trend after it is established and exit in time when the trend reverses, avoiding chasing tops and selling bottoms. It also incorporates time range testing to backtest the strategy’s effectiveness over different time periods.

Trading Logic

  1. The fast and slow moving averages build a dual-rail channel system. When the fast MA crosses over the slow MA, it is a golden cross entry signal for long. When the fast MA crosses below the slow MA, it is a death cross exit signal.

  2. The ADX judges the existence and strength of a trend. When ADX is above the key level, it indicates that a trend exists and is strong. Trading signals are only generated when the trend is strong.

  3. The DI+ of DMI determines the direction of the trend. When DI+ is positive, it indicates an upward trend. When DI+ is negative, it indicates a downward trend. Trading signals are only generated when the trend direction matches.

  4. Time range testing backtests the strategy’s effectiveness over different time periods for verification.

Advantage Analysis

  1. The dual-rail system filters breakouts to avoid false signals.

  2. The ADX avoids excessive trading during consolidation by requiring a trend.

  3. The DMI ensures trades match the trend direction, preventing counter-trend trades.

  4. Time range testing verifies parameters and optimizes settings.

Risk Analysis

  1. The channels may form traps, requiring stops to avoid whipsaws.

  2. ADX lags may miss early opportunities, requiring a lower key level.

  3. DMI direction lags may also miss early trends, needing shorter periods.

  4. Parameters may need adjustment across time ranges.

Optimization

  1. Test parameter combinations to find optimal settings.

  2. Add filters like Bollinger Bands for signal quality.

  3. Incorporate stop loss to limit losses.

  4. Auto-optimize parameters with machine learning.

  5. Incorporate more factors like sentiment and news.

Conclusion

This strategy combines the strengths of moving averages, trend indexes and directional indexes to identify and track trends. While verifying parameter validity, continued optimization is needed to adapt to more market conditions by tuning parameters, adding stops, synthesizing more factors, and so on, to improve robustness and profitability. Overall, it provides a reliable trend following methodology for quantitative trading.


/*backtest
start: 2023-10-01 00:00:00
end: 2023-10-31 23:59:59
period: 1d
basePeriod: 1h
exchanges: [{"eid":"Futures_Binance","currency":"BTC_USDT"}]
*/

//@version=4
// author: codachang0726
strategy(title = "(S)MA+ADX+DI+time", shorttitle = "(S)MA+ADX+DI+time", overlay = true)

// === INPUT MA LENGTHS ===
fastMA    = input(defval = 7,   title = "FastMA",          minval = 1, step = 1)
slowMA    = input(defval = 14,   title = "SlowMA",          minval = 1, step = 1)

// === INPUT BACKTEST RANGE ===
fromMonth = input(defval = 9,    title = "From Month",      minval = 1, maxval = 12)
fromDay   = input(defval = 1,    title = "From Day",        minval = 1, maxval = 31)
fromYear  = input(defval = 2020, title = "From Year",       minval = 1970)
thruMonth = input(defval = 1,    title = "Thru Month",      minval = 1, maxval = 12)
thruDay   = input(defval = 1,    title = "Thru Day",        minval = 1, maxval = 31)
thruYear  = input(defval = 2022, title = "Thru Year",       minval = 1970)

// === INPUT SHOW PLOT ===
showDate  = input(defval = true, title = "Show Date Range", type = input.bool)

// === FUNCTION EXAMPLE ===
start     = timestamp(fromYear, fromMonth, fromDay, 00, 00)        // backtest start window
finish    = timestamp(thruYear, thruMonth, thruDay, 23, 59)        // backtest finish window
window()  => true       // create function "within window of time"

// === MA LOGIC ===
crossOv   =  sma(close, fastMA) > sma(close, slowMA)     // true when fastMA over slowMA
crossUn   =  sma(close, fastMA) < sma(close, slowMA)     // true when fastMA under slowMA

// DI+ADX
adxlen      = input(14, title="ADX Smoothing")
dilen       = input(14, title="DI Period")
keyLevel    = input(20, title="Keylevel for ADX")
[diplus, diminus, adx] = dmi(dilen, adxlen)
di = (diplus - diminus)

buy = di > 0 and crossOv and adx > keyLevel
sell = di < 0 and crossUn and adx > keyLevel

buy_time = buy and not buy[1]
sell_time = sell and not sell[1]

// === EXECUTION ===
strategy.entry("L", strategy.long, when = window() and buy_time)    // enter long when "within window of time" AND crossover
strategy.close("L", when = window() and sell_time)                   // exit long when "within window of time" AND crossunder         

// === PLOTTING ===
bgcolor(color = showDate and window() ? color.gray : na, transp = 90)                                     // plot "within window of time"
plot(sma(close, fastMA), title = 'FastMA', color = color.yellow, linewidth = 2, style = plot.style_line)  // plot FastMA
plot(sma(close, slowMA), title = 'SlowMA', color = color.aqua,   linewidth = 2, style = plot.style_line)  // plot SlowMA


More